| Player | Player Sort | Pos | Salary | Salary Sort | Pct | Pct Sort | WARP | WARP Sort | WARP/$M | WARP/$M Sort | $/WARP | $/WARP Sort | Current Status |
|---|
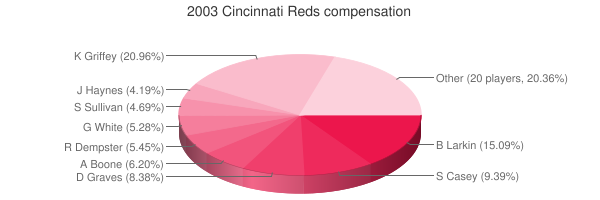
 Ken Griffey Jr.
 |
Griffey Ken |
CF |
$12,500,000 |
12500000 |
21.35% |
21.35 |
1.15 |
1.15408 |
0.09 |
0.0923264 |
$10,831,138 |
10831138.222654 |
|
 Barry Larkin
 |
Larkin Barry |
SS |
$9,000,000 |
9000000 |
15.37% |
15.37 |
1.01 |
1.01445 |
0.11 |
0.11271666666667 |
$8,871,802 |
8871802.454532 |
|
 Sean Casey
 |
Casey Sean |
1B |
$5,600,000 |
5600000 |
9.57% |
9.57 |
0.23 |
0.231552 |
0.04 |
0.041348571428571 |
$24,184,632 |
24184632.393588 |
|
 Danny Graves
 |
Graves Danny |
RP |
$5,000,000 |
5000000 |
8.54% |
8.54 |
-1.86 |
-1.85737 |
— |
0 |
— |
0 |
|
 Aaron Boone
 |
Boone Aaron |
3B |
$3,700,000 |
3700000 |
6.32% |
6.32 |
2.21 |
2.20893 |
0.60 |
0.59700810810811 |
$1,675,019 |
1675019.1269076 |
|
 Ryan Dempster
 |
Dempster Ryan |
RP |
$3,250,000 |
3250000 |
5.55% |
5.55 |
-1.38 |
-1.37892 |
— |
0 |
— |
0 |
|
 Gabe White
 |
White Gabe |
RP |
$3,150,000 |
3150000 |
5.38% |
5.38 |
-0.43 |
-0.425267 |
— |
0 |
— |
0 |
|
 Scott Sullivan
 |
Sullivan Scott |
RP |
$2,800,000 |
2800000 |
4.78% |
4.78 |
0.28 |
0.277926 |
0.10 |
0.099259285714286 |
$10,074,624 |
10074624.180537 |
|
 Jimmy Haynes
 |
Haynes Jimmy |
RP |
$2,500,000 |
2500000 |
4.27% |
4.27 |
-1.95 |
-1.94874 |
— |
0 |
— |
0 |
|
 Scott Williamson
 |
Williamson Scott |
RP |
$1,600,000 |
1600000 |
2.73% |
2.73 |
1.04 |
1.04454 |
0.65 |
0.6528375 |
$1,531,775 |
1531774.7525226 |
|
 Kelly Stinnett
 |
Stinnett Kelly |
C |
$1,300,000 |
1300000 |
2.22% |
2.22 |
-0.33 |
-0.332134 |
— |
0 |
— |
0 |
|
 Jason LaRue
 |
LaRue Jason |
C |
$1,250,000 |
1250000 |
2.14% |
2.14 |
0.73 |
0.729994 |
0.58 |
0.5839952 |
$1,712,343 |
1712342.841174 |
|
 Juan Castro
 |
Castro Juan |
2B |
$800,000 |
800000 |
1.37% |
1.37 |
0.04 |
0.0364857 |
0.05 |
0.045607125 |
$21,926,399 |
21926398.561628 |
|
 Wily Mo Pena
 |
Pena Wily Mo |
PH |
$788,000 |
788000 |
1.35% |
1.35 |
-0.63 |
-0.631962 |
— |
0 |
— |
0 |
|
 Jimmy Anderson
 |
Anderson Jimmy |
RP |
$600,000 |
600000 |
1.02% |
1.02 |
-0.67 |
-0.668628 |
— |
0 |
— |
0 |
|
 Felix Heredia
 |
Heredia Felix |
RP |
$600,000 |
600000 |
1.02% |
1.02 |
-0.52 |
-0.524228 |
— |
0 |
— |
0 |
|
 Kent Mercker
 |
Mercker Kent |
RP |
$550,000 |
550000 |
0.94% |
0.94 |
0.02 |
0.0183556 |
0.03 |
0.033373818181818 |
$29,963,608 |
29963607.836301 |
|
 Josias Manzanillo
 |
Manzanillo Josias |
RP |
$500,000 |
500000 |
0.85% |
0.85 |
0.20 |
0.203405 |
0.41 |
0.40681 |
$2,458,150 |
2458149.9963128 |
|
 Paul Wilson
 |
Wilson Paul |
RP |
$500,000 |
500000 |
0.85% |
0.85 |
0.04 |
0.0441821 |
0.09 |
0.0883642 |
$11,316,800 |
11316800.242632 |
|
 Adam Dunn
 |
Dunn Adam |
LF |
$400,000 |
400000 |
0.68% |
0.68 |
2.80 |
2.7966 |
6.99 |
6.9915 |
$143,031 |
143030.82314239 |
|
 Russell Branyan
 |
Branyan Russell |
PH |
$395,000 |
395000 |
0.67% |
0.67 |
0.81 |
0.810099 |
2.05 |
2.0508835443038 |
$487,595 |
487594.72607669 |
|
 Luke Prokopec
 |
Prokopec Luke |
DNP |
$390,000 |
390000 |
0.67% |
0.67 |
— |
0.00 |
— |
0 |
— |
0 |
|
 Austin Kearns
 |
Kearns Austin |
RF |
$350,000 |
350000 |
0.60% |
0.60 |
1.60 |
1.60194 |
4.58 |
4.5769714285714 |
$218,485 |
218485.08683222 |
|
 John Riedling
 |
Riedling John |
RP |
$350,000 |
350000 |
0.60% |
0.60 |
0.29 |
0.29367 |
0.84 |
0.83905714285714 |
$1,191,814 |
1191813.9408179 |
|
 Felipe Lopez
 |
Lopez Felipe |
SS |
$334,000 |
334000 |
0.57% |
0.57 |
0.65 |
0.65041 |
1.95 |
1.9473353293413 |
$513,522 |
513522.23981796 |
|
 Reggie Taylor
 |
Taylor Reggie |
CF |
$334,000 |
334000 |
0.57% |
0.57 |
-0.77 |
-0.768082 |
— |
0 |
— |
0 |
|
| Year | Reds payroll |
PR Sort |
Avg payroll |
AvgPR Sort |
Diff |
Diff Sort |
|---|
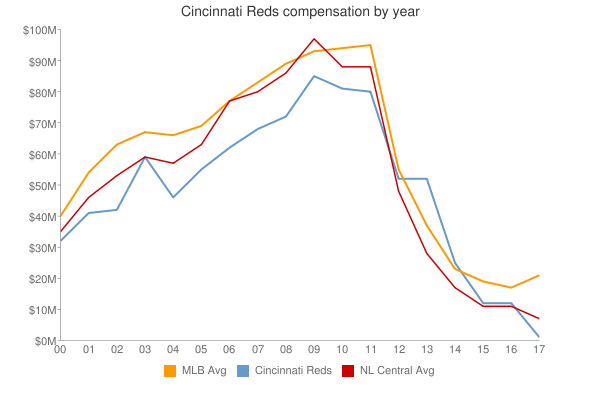
| 2000 | $44,767,200 | 44767200 | $55,368,142 | 55368142 | $-10,600,942 | -10600942 |
| 2001 | $47,974,000 | 47974000 | $64,937,084 | 64937084 | $-16,963,084 | -16963084 |
| 2002 | $43,203,890 | 43203890 | $67,238,672 | 67238672 | $-24,034,782 | -24034782 |
| 2003 | $58,541,000 | 58541000 | $70,654,480 | 70654480 | $-12,113,480 | -12113480 |
| 2004 | $46,697,250 | 46697250 | $69,466,729 | 69466729 | $-22,769,479 | -22769479 |
| 2005 | $62,594,583 | 62594583 | $74,114,841 | 74114841 | $-11,520,258 | -11520258 |
| 2006 | $63,631,833 | 63631833 | $79,621,815 | 79621815 | $-15,989,982 | -15989982 |
| 2007 | $69,910,833 | 69910833 | $85,537,470 | 85537470 | $-15,626,637 | -15626637 |
| 2008 | $72,240,000 | 72240000 | $92,003,799 | 92003799 | $-19,763,799 | -19763799 |
| 2009 | $72,283,500 | 72283500 | $92,169,598 | 92169598 | $-19,886,098 | -19886098 |
| 2010 | $76,876,500 | 76876500 | $94,342,601 | 94342601 | $-17,466,101 | -17466101 |
| 2011 | $76,631,134 | 76631134 | $96,974,710 | 96974710 | $-20,343,576 | -20343576 |
| 2012 | $87,826,167 | 87826167 | $100,947,217 | 100947217 | $-13,121,050 | -13121050 |
| 2013 | $111,105,533 | 111105533 | $108,586,966 | 108586966 | $2,518,567 | 2518567 |
| 2014 | $115,384,724 | 115384724 | $117,131,361 | 117131361 | $-1,746,637 | -1746637 |
| 2015 | $115,373,953 | 115373953 | $126,168,161 | 126168161 | $-10,794,208 | -10794208 |
| 2016 | $90,416,228 | 90416228 | $131,756,569 | 131756569 | $-41,340,341 | -41340341 |
| 2017 | $95,375,786 | 95375786 | $136,337,445 | 136337445 | $-40,961,659 | -40961659 |
| 2018 | $101,337,500 | 101337500 | $135,360,600 | 135360600 | $-34,023,100 | -34023100 |
| 2019 | $127,218,214 | 127218214 | $134,792,134 | 134792134 | $-7,573,920 | -7573920 |
| 2020 | $145,670,792 | 145670792 | $139,496,467 | 139496467 | $6,174,325 | 6174325 |
| 2021 | $129,642,381 | 129642381 | $130,712,288 | 130712288 | $-1,069,907 | -1069907 |
| 2022 | $107,955,000 | 107955000 | $149,802,695 | 149802695 | $-41,847,695 | -41847695 |
| 2023 | $94,198,333 | 94198333 | $161,692,345 | 161692345 | $-67,494,012 | -67494012 |
| 2024 | $100,758,333 | 100758333 | $136,306,249 | 136306249 | $-35,547,916 | -35547916 |
| 2025 | $74,483,333 | 74483333 | $98,329,527 | 98329527 | $-23,846,194 | -23846194 |
| 2026 | $45,483,333 | 45483333 | $78,039,273 | 78039273 | $-32,555,940 | -32555940 |
| 2027 | $42,483,333 | 42483333 | $60,919,343 | 60919343 | $-18,436,010 | -18436010 |
| 2028 | $16,333,333 | 16333333 | $46,901,712 | 46901712 | $-30,568,379 | -30568379 |
| 2029 | $2,000,000 | 2000000 | $38,597,944 | 38597944 | $-36,597,944 | -36597944 |
|
 2003 Cincinnati Reds