| Player | Player Sort | Pos | Salary | Salary Sort | Pct | Pct Sort | WARP | WARP Sort | WARP/$M | WARP/$M Sort | $/WARP | $/WARP Sort | Current Status |
|---|
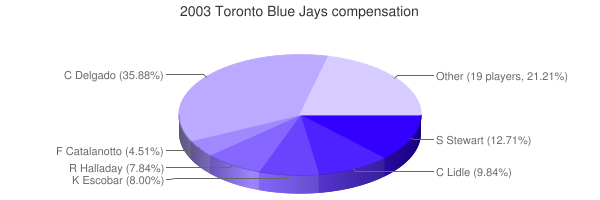
 Carlos Delgado
 |
Delgado Carlos |
1B |
$17,500,000 |
17500000 |
35.23% |
35.23 |
4.79 |
4.79224 |
0.27 |
0.27384228571429 |
$3,651,737 |
3651736.9747759 |
|
 Shannon Stewart
 |
Stewart Shannon |
LF |
$6,200,000 |
6200000 |
12.48% |
12.48 |
1.34 |
1.34057 |
0.22 |
0.21622096774194 |
$4,624,898 |
4624898.3641287 |
|
 Cory Lidle
 |
Lidle Cory |
RP |
$4,800,000 |
4800000 |
9.66% |
9.66 |
0.21 |
0.20871 |
0.04 |
0.04348125 |
$22,998,419 |
22998418.858703 |
|
 Kelvim Escobar
 |
Escobar Kelvim |
RP |
$3,900,000 |
3900000 |
7.85% |
7.85 |
2.60 |
2.60001 |
0.67 |
0.66666923076923 |
$1,499,994 |
1499994.2307914 |
|
 Roy Halladay
 |
Halladay Roy |
RP |
$3,825,000 |
3825000 |
7.70% |
7.70 |
8.57 |
8.56867 |
2.24 |
2.2401751633987 |
$446,394 |
446393.66436098 |
|
 Frank Catalanotto
 |
Catalanotto Frank |
LF |
$2,200,000 |
2200000 |
4.43% |
4.43 |
1.37 |
1.36611 |
0.62 |
0.62095909090909 |
$1,610,412 |
1610412.0458821 |
|
 Tanyon Sturtze
 |
Sturtze Tanyon |
RP |
$1,000,000 |
1000000 |
2.01% |
2.01 |
-1.98 |
-1.98312 |
— |
0 |
— |
0 |
|
 Mike Bordick
 |
Bordick Mike |
SS |
$1,000,000 |
1000000 |
2.01% |
2.01 |
0.81 |
0.812232 |
0.81 |
0.812232 |
$1,231,175 |
1231175.3292163 |
|
 Cliff Politte
 |
Politte Cliff |
RP |
$845,000 |
845000 |
1.70% |
1.70 |
-0.26 |
-0.262296 |
— |
0 |
— |
0 |
|
 Greg Myers
 |
Myers Greg |
C |
$800,000 |
800000 |
1.61% |
1.61 |
1.38 |
1.38024 |
1.73 |
1.7253 |
$579,609 |
579609.34330261 |
|
 Chris Woodward
 |
Woodward Chris |
SS |
$775,000 |
775000 |
1.56% |
1.56 |
0.69 |
0.688796 |
0.89 |
0.88876903225806 |
$1,125,152 |
1125151.7140053 |
|
 Doug Creek
 |
Creek Doug |
RP |
$700,000 |
700000 |
1.41% |
1.41 |
-0.40 |
-0.404486 |
— |
0 |
— |
0 |
|
 Dave Berg
 |
Berg Dave |
2B |
$700,000 |
700000 |
1.41% |
1.41 |
-0.54 |
-0.53731 |
— |
0 |
— |
0 |
|
 Jeff Tam
 |
Tam Jeff |
RP |
$600,000 |
600000 |
1.21% |
1.21 |
-0.58 |
-0.576531 |
— |
0 |
— |
0 |
|
 Eric Hinske
 |
Hinske Eric |
3B |
$600,000 |
600000 |
1.21% |
1.21 |
1.34 |
1.34087 |
2.23 |
2.2347833333333 |
$447,471 |
447470.67202637 |
|
 Vernon Wells
 |
Wells Vernon |
CF |
$520,000 |
520000 |
1.05% |
1.05 |
4.50 |
4.49528 |
8.64 |
8.6447692307692 |
$115,677 |
115676.88775783 |
|
 Dan Reichert
 |
Reichert Dan |
RP |
$510,000 |
510000 |
1.03% |
1.03 |
-0.04 |
-0.0449394 |
— |
0 |
— |
0 |
|
 Pete Walker
 |
Walker Pete |
RP |
$425,000 |
425000 |
0.86% |
0.86 |
-1.04 |
-1.04134 |
— |
0 |
— |
0 |
|
 Josh Phelps
 |
Phelps Josh |
DH |
$320,000 |
320000 |
0.64% |
0.64 |
0.89 |
0.892184 |
2.79 |
2.788075 |
$358,670 |
358670.4087946 |
|
 Tom Wilson
 |
Wilson Tom |
C |
$316,000 |
316000 |
0.64% |
0.64 |
0.90 |
0.896258 |
2.84 |
2.8362594936709 |
$352,577 |
352577.04812677 |
|
 Orlando Hudson
 |
Hudson Orlando |
2B |
$313,000 |
313000 |
0.63% |
0.63 |
2.54 |
2.5408 |
8.12 |
8.117571884984 |
$123,190 |
123189.5465995 |
|
 Ken Huckaby
 |
Huckaby Ken |
C |
$313,000 |
313000 |
0.63% |
0.63 |
-0.02 |
-0.0227317 |
— |
0 |
— |
0 |
|
 Bob File
 |
File Bob |
DNP |
$310,000 |
310000 |
0.62% |
0.62 |
— |
0.00 |
— |
0 |
— |
0 |
|
 Trever Miller
 |
Miller Trever |
RP |
$305,000 |
305000 |
0.61% |
0.61 |
0.14 |
0.137768 |
0.45 |
0.45169836065574 |
$2,213,867 |
2213866.7905464 |
|
 Mark Hendrickson
 |
Hendrickson Mark |
RP |
$302,000 |
302000 |
0.61% |
0.61 |
-1.92 |
-1.916 |
— |
0 |
— |
0 |
|
 Aquilino Lopez
 |
Lopez Aquilino |
RP |
$300,000 |
300000 |
0.60% |
0.60 |
0.82 |
0.818317 |
2.73 |
2.7277233333333 |
$366,606 |
366606.09519294 |
|
 Jayson Werth
 |
Werth Jayson |
RF |
$300,000 |
300000 |
0.60% |
0.60 |
-0.11 |
-0.106097 |
— |
0 |
— |
0 |
|
| Year | Blue Jays payroll |
PR Sort |
Avg payroll |
AvgPR Sort |
Diff |
Diff Sort |
|---|
| 2000 | $45,518,332 | 45518332 | $55,368,142 | 55368142 | $-9,849,810 | -9849810 |
| 2001 | $76,322,999 | 76322999 | $64,937,084 | 64937084 | $11,385,915 | 11385915 |
| 2002 | $76,464,333 | 76464333 | $67,238,672 | 67238672 | $9,225,661 | 9225661 |
| 2003 | $49,679,000 | 49679000 | $70,654,480 | 70654480 | $-20,975,480 | -20975480 |
| 2004 | $49,018,000 | 49018000 | $69,466,729 | 69466729 | $-20,448,729 | -20448729 |
| 2005 | $45,801,500 | 45801500 | $74,114,841 | 74114841 | $-28,313,341 | -28313341 |
| 2006 | $69,295,000 | 69295000 | $79,621,815 | 79621815 | $-10,326,815 | -10326815 |
| 2007 | $84,315,000 | 84315000 | $85,537,470 | 85537470 | $-1,222,470 | -1222470 |
| 2008 | $104,368,800 | 104368800 | $92,003,799 | 92003799 | $12,365,001 | 12365001 |
| 2009 | $81,842,100 | 81842100 | $92,169,598 | 92169598 | $-10,327,498 | -10327498 |
| 2010 | $76,189,000 | 76189000 | $94,342,601 | 94342601 | $-18,153,601 | -18153601 |
| 2011 | $70,317,800 | 70317800 | $96,974,710 | 96974710 | $-26,656,910 | -26656910 |
| 2012 | $83,739,200 | 83739200 | $100,947,217 | 100947217 | $-17,208,017 | -17208017 |
| 2013 | $127,777,800 | 127777800 | $108,586,966 | 108586966 | $19,190,834 | 19190834 |
| 2014 | $137,177,700 | 137177700 | $117,131,361 | 117131361 | $20,046,339 | 20046339 |
| 2015 | $125,915,800 | 125915800 | $126,168,161 | 126168161 | $-252,361 | -252361 |
| 2016 | $136,782,027 | 136782027 | $131,756,569 | 131756569 | $5,025,458 | 5025458 |
| 2017 | $163,381,937 | 163381937 | $136,337,445 | 136337445 | $27,044,492 | 27044492 |
| 2018 | $162,037,223 | 162037223 | $135,360,600 | 135360600 | $26,676,623 | 26676623 |
| 2019 | $117,546,171 | 117546171 | $134,792,134 | 134792134 | $-17,245,963 | -17245963 |
| 2020 | $108,987,471 | 108987471 | $139,496,467 | 139496467 | $-30,508,996 | -30508996 |
| 2021 | $140,375,671 | 140375671 | $130,712,288 | 130712288 | $9,663,383 | 9663383 |
| 2022 | $166,851,121 | 166851121 | $149,802,695 | 149802695 | $17,048,426 | 17048426 |
| 2023 | $186,938,983 | 186938983 | $161,692,345 | 161692345 | $25,246,638 | 25246638 |
| 2024 | $181,399,600 | 181399600 | $136,306,249 | 136306249 | $45,093,351 | 45093351 |
| 2025 | $130,750,000 | 130750000 | $98,329,527 | 98329527 | $32,420,473 | 32420473 |
| 2026 | $95,166,667 | 95166667 | $78,039,273 | 78039273 | $17,127,394 | 17127394 |
| 2027 | $30,000,000 | 30000000 | $60,919,343 | 60919343 | $-30,919,343 | -30919343 |
| 2028 | $30,000,000 | 30000000 | $46,901,712 | 46901712 | $-16,901,712 | -16901712 |
|
 2003 Toronto Blue Jays