| Player | Player Sort | Pos | Salary | Salary Sort | Pct | Pct Sort | WARP | WARP Sort | WARP/$M | WARP/$M Sort | $/WARP | $/WARP Sort | Current Status |
|---|
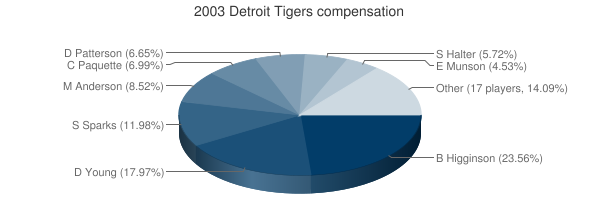
 Bobby Higginson
 |
Higginson Bobby |
RF |
$11,850,000 |
11850000 |
21.17% |
21.17 |
-0.39 |
-0.385774 |
— |
0 |
— |
0 |
|
 Dean Palmer
 |
Palmer Dean |
DH |
$8,500,000 |
8500000 |
15.19% |
15.19 |
-1.00 |
-1.00471 |
— |
0 |
— |
0 |
|
 Dmitri Young
 |
Young Dmitri |
DH |
$6,750,000 |
6750000 |
12.06% |
12.06 |
4.54 |
4.53567 |
0.67 |
0.67195111111111 |
$1,488,204 |
1488203.5068689 |
|
 Damion Easley
 |
Easley Damion |
DNP |
$6,500,000 |
6500000 |
11.61% |
11.61 |
— |
0.00 |
— |
0 |
— |
0 |
|
 Steve Sparks
 |
Sparks Steve |
RP |
$4,500,000 |
4500000 |
8.04% |
8.04 |
-0.07 |
-0.0674173 |
— |
0 |
— |
0 |
|
 Matt Anderson
 |
Anderson Matt |
RP |
$3,200,000 |
3200000 |
5.72% |
5.72 |
0.15 |
0.145562 |
0.05 |
0.045488125 |
$21,983,759 |
21983759.497671 |
|
 Craig Paquette
 |
Paquette Craig |
1B |
$2,625,000 |
2625000 |
4.69% |
4.69 |
-0.57 |
-0.570939 |
— |
0 |
— |
0 |
|
 Danny Patterson
 |
Patterson Danny |
RP |
$2,500,000 |
2500000 |
4.47% |
4.47 |
0.38 |
0.379503 |
0.15 |
0.1518012 |
$6,587,563 |
6587563.207669 |
|
 Shane Halter
 |
Halter Shane |
3B |
$2,150,000 |
2150000 |
3.84% |
3.84 |
0.06 |
0.0615037 |
0.03 |
0.028606372093023 |
$34,957,246 |
34957246.474602 |
|
 Eric Munson
 |
Munson Eric |
3B |
$1,700,000 |
1700000 |
3.04% |
3.04 |
0.61 |
0.607285 |
0.36 |
0.35722647058824 |
$2,799,345 |
2799344.6240233 |
|
 Matt Walbeck
 |
Walbeck Matt |
C |
$400,000 |
400000 |
0.71% |
0.71 |
-1.09 |
-1.09019 |
— |
0 |
— |
0 |
|
 Jamie Walker
 |
Walker Jamie |
RP |
$360,000 |
360000 |
0.64% |
0.64 |
0.70 |
0.700894 |
1.95 |
1.9469277777778 |
$513,630 |
513629.7357375 |
|
 Gene Kingsale
 |
Kingsale Gene |
CF |
$340,000 |
340000 |
0.61% |
0.61 |
-0.88 |
-0.879933 |
— |
0 |
— |
0 |
|
 Hiram Bocachica
 |
Bocachica Hiram |
CF |
$325,000 |
325000 |
0.58% |
0.58 |
-0.37 |
-0.366838 |
— |
0 |
— |
0 |
|
 Brandon Inge
 |
Inge Brandon |
C |
$315,000 |
315000 |
0.56% |
0.56 |
-1.41 |
-1.41415 |
— |
0 |
— |
0 |
|
 Adam Bernero
 |
Bernero Adam |
RP |
$314,000 |
314000 |
0.56% |
0.56 |
0.19 |
0.192556 |
0.61 |
0.61323566878981 |
$1,630,694 |
1630694.4473296 |
|
 Carlos Pena
 |
Pena Carlos |
1B |
$310,000 |
310000 |
0.55% |
0.55 |
0.49 |
0.490535 |
1.58 |
1.5823709677419 |
$631,963 |
631963.0607398 |
|
 Mike Maroth
 |
Maroth Mike |
RP |
$309,000 |
309000 |
0.55% |
0.55 |
-1.06 |
-1.0647 |
— |
0 |
— |
0 |
|
 Ramon Santiago
 |
Santiago Ramon |
SS |
$307,000 |
307000 |
0.55% |
0.55 |
-1.27 |
-1.26785 |
— |
0 |
— |
0 |
|
 Chris Spurling
 |
Spurling Chris |
RP |
$305,000 |
305000 |
0.54% |
0.54 |
0.26 |
0.264749 |
0.87 |
0.86802950819672 |
$1,152,035 |
1152034.5685914 |
|
 Gary Knotts
 |
Knotts Gary |
RP |
$305,000 |
305000 |
0.54% |
0.54 |
-0.88 |
-0.880342 |
— |
0 |
— |
0 |
|
 Nate Cornejo
 |
Cornejo Nate |
RP |
$303,000 |
303000 |
0.54% |
0.54 |
-2.16 |
-2.16238 |
— |
0 |
— |
0 |
|
 Jeremy Bonderman
 |
Bonderman Jeremy |
RP |
$300,000 |
300000 |
0.54% |
0.54 |
1.55 |
1.55232 |
5.17 |
5.1744 |
$193,259 |
193259.12183055 |
|
 Wilfredo Ledezma
 |
Ledezma Wilfredo |
RP |
$300,000 |
300000 |
0.54% |
0.54 |
-1.05 |
-1.0537 |
— |
0 |
— |
0 |
|
 Alexis Gomez
 |
Gomez Alexis |
DNP |
$300,000 |
300000 |
0.54% |
0.54 |
— |
0.00 |
— |
0 |
— |
0 |
|
 Matt Roney
 |
Roney Matt |
RP |
$300,000 |
300000 |
0.54% |
0.54 |
-2.27 |
-2.27 |
— |
0 |
— |
0 |
|
 Franklyn German
 |
German Franklyn |
RP |
$300,000 |
300000 |
0.54% |
0.54 |
-0.43 |
-0.431263 |
— |
0 |
— |
0 |
|
 Omar Infante
 |
Infante Omar |
SS |
$300,000 |
300000 |
0.54% |
0.54 |
0.61 |
0.612081 |
2.04 |
2.04027 |
$490,131 |
490131.20812441 |
|
| Year | Tigers payroll |
PR Sort |
Avg payroll |
AvgPR Sort |
Diff |
Diff Sort |
|---|
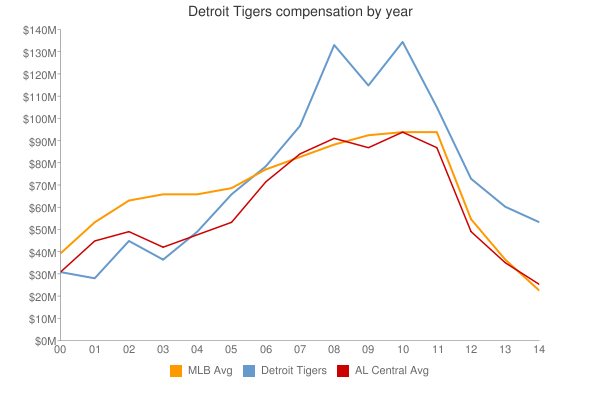
| 2000 | $60,225,167 | 60225167 | $55,368,142 | 55368142 | $4,857,025 | 4857025 |
| 2001 | $48,524,167 | 48524167 | $64,937,084 | 64937084 | $-16,412,917 | -16412917 |
| 2002 | $54,640,500 | 54640500 | $67,238,672 | 67238672 | $-12,598,172 | -12598172 |
| 2003 | $55,968,000 | 55968000 | $70,654,480 | 70654480 | $-14,686,480 | -14686480 |
| 2004 | $61,141,000 | 61141000 | $69,466,729 | 69466729 | $-8,325,729 | -8325729 |
| 2005 | $67,868,500 | 67868500 | $74,114,841 | 74114841 | $-6,246,341 | -6246341 |
| 2006 | $85,198,456 | 85198456 | $79,621,815 | 79621815 | $5,576,641 | 5576641 |
| 2007 | $97,708,500 | 97708500 | $85,537,470 | 85537470 | $12,171,030 | 12171030 |
| 2008 | $138,175,833 | 138175833 | $92,003,799 | 92003799 | $46,172,034 | 46172034 |
| 2009 | $116,053,000 | 116053000 | $92,169,598 | 92169598 | $23,883,402 | 23883402 |
| 2010 | $134,062,066 | 134062066 | $94,342,601 | 94342601 | $39,719,465 | 39719465 |
| 2011 | $107,019,667 | 107019667 | $96,974,710 | 96974710 | $10,044,957 | 10044957 |
| 2012 | $133,060,667 | 133060667 | $100,947,217 | 100947217 | $32,113,450 | 32113450 |
| 2013 | $148,314,500 | 148314500 | $108,586,966 | 108586966 | $39,727,534 | 39727534 |
| 2014 | $163,635,500 | 163635500 | $117,131,361 | 117131361 | $46,504,139 | 46504139 |
| 2015 | $172,792,250 | 172792250 | $126,168,161 | 126168161 | $46,624,089 | 46624089 |
| 2016 | $198,593,000 | 198593000 | $131,756,569 | 131756569 | $66,836,431 | 66836431 |
| 2017 | $199,750,600 | 199750600 | $136,337,445 | 136337445 | $63,413,155 | 63413155 |
| 2018 | $125,286,000 | 125286000 | $135,360,600 | 135360600 | $-10,074,600 | -10074600 |
| 2019 | $115,673,500 | 115673500 | $134,792,134 | 134792134 | $-19,118,634 | -19118634 |
| 2020 | $103,966,600 | 103966600 | $139,496,467 | 139496467 | $-35,529,867 | -35529867 |
| 2021 | $82,366,200 | 82366200 | $130,712,288 | 130712288 | $-48,346,088 | -48346088 |
| 2022 | $129,413,500 | 129413500 | $149,802,695 | 149802695 | $-20,389,195 | -20389195 |
| 2023 | $122,236,500 | 122236500 | $161,692,345 | 161692345 | $-39,455,845 | -39455845 |
| 2024 | $95,073,933 | 95073933 | $136,306,249 | 136306249 | $-41,232,316 | -41232316 |
| 2025 | $39,593,333 | 39593333 | $98,329,527 | 98329527 | $-58,736,194 | -58736194 |
| 2026 | $28,333,333 | 28333333 | $78,039,273 | 78039273 | $-49,705,940 | -49705940 |
| 2027 | $28,333,333 | 28333333 | $60,919,343 | 60919343 | $-32,586,010 | -32586010 |
| 2028 | $5,333,333 | 5333333 | $46,901,712 | 46901712 | $-41,568,379 | -41568379 |
| 2029 | $5,333,333 | 5333333 | $38,597,944 | 38597944 | $-33,264,611 | -33264611 |
| 2030 | $2,642,500 | 2642500 | $41,447,579 | 41447579 | $-38,805,079 | -38805079 |
|
 2003 Detroit Tigers


