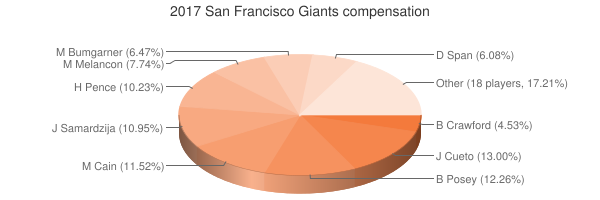
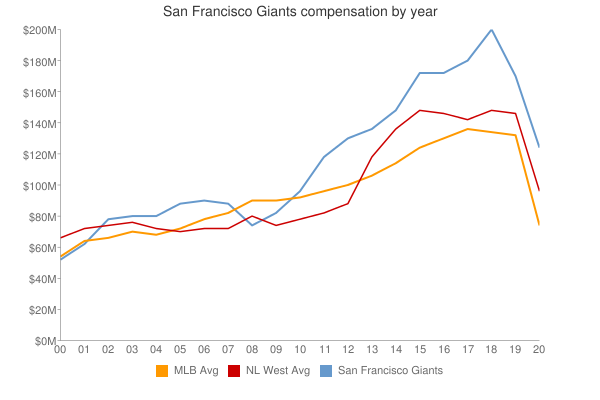
| Player | Player Sort | Pos | Salary | Salary Sort | Pct | Pct Sort | WARP | WARP Sort | WARP/$M | WARP/$M Sort | $/WARP | $/WARP Sort | Current Status |
|---|
 Johnny Cueto
 |
Cueto Johnny |
SP |
$23,500,000 |
23500000 |
13.00% |
13.00 |
1.52 |
1.52422 |
0.06 |
0.064860425531915 |
$15,417,722 |
15417721.851176 |
|
 Buster Posey
 |
Posey Buster |
C |
$22,177,778 |
22177778 |
12.26% |
12.26 |
6.00 |
5.99771 |
0.27 |
0.2704378229415 |
$3,697,708 |
3697707.6250769 |
|
 Matt Cain
 |
Cain Matt |
SP |
$20,833,333 |
20833333 |
11.52% |
11.52 |
-0.35 |
-0.347537 |
— |
0 |
— |
0 |
|
 Jeff Samardzija
 |
Samardzija Jeff |
SP |
$19,800,000 |
19800000 |
10.95% |
10.95 |
5.17 |
5.16946 |
0.26 |
0.26108383838384 |
$3,830,187 |
3830187.2922897 |
|
 Hunter Pence
 |
Pence Hunter |
RF |
$18,500,000 |
18500000 |
10.23% |
10.23 |
1.85 |
1.85355 |
0.10 |
0.10019189189189 |
$9,980,848 |
9980847.5627849 |
|
 Mark Melancon
 |
Melancon Mark |
RP |
$14,000,000 |
14000000 |
7.74% |
7.74 |
0.81 |
0.810567 |
0.06 |
0.057897642857143 |
$17,271,860 |
17271860.315063 |
|
 Madison Bumgarner
 |
Bumgarner Madison |
SP |
$11,700,000 |
11700000 |
6.47% |
6.47 |
2.78 |
2.78358 |
0.24 |
0.23791282051282 |
$4,203,220 |
4203220.3134093 |
|
 Denard Span
 |
Span Denard |
CF |
$11,000,000 |
11000000 |
6.08% |
6.08 |
1.21 |
1.21439 |
0.11 |
0.11039909090909 |
$9,058,046 |
9058045.6031423 |
|
 Brandon Crawford
 |
Crawford Brandon |
SS |
$8,200,000 |
8200000 |
4.53% |
4.53 |
2.79 |
2.78674 |
0.34 |
0.33984634146341 |
$2,942,506 |
2942506.2976812 |
|
 Matt Moore
 |
Moore Matt |
SP |
$7,000,000 |
7000000 |
3.87% |
3.87 |
0.41 |
0.405881 |
0.06 |
0.057983 |
$17,246,434 |
17246434.299709 |
|
 Eduardo Núñez
 |
Nunez Eduardo |
3B |
$4,200,000 |
4200000 |
2.32% |
2.32 |
1.96 |
1.95897 |
0.47 |
0.46642142857143 |
$2,143,984 |
2143983.8282363 |
|
 Brandon Belt
 |
Belt Brandon |
1B |
$4,000,000 |
4000000 |
2.21% |
2.21 |
3.37 |
3.36949 |
0.84 |
0.8423725 |
$1,187,123 |
1187123.2738486 |
|
 Will Smith
 |
Smith Will |
DNP |
$2,500,000 |
2500000 |
1.38% |
1.38 |
— |
0.00 |
— |
0 |
— |
0 |
|
 Aaron Hill
 |
Hill Aaron |
PH |
$2,000,000 |
2000000 |
1.11% |
1.11 |
-0.42 |
-0.42333 |
— |
0 |
— |
0 |
|
 Nick Hundley
 |
Hundley Nick |
C |
$2,000,000 |
2000000 |
1.11% |
1.11 |
0.78 |
0.776644 |
0.39 |
0.388322 |
$2,575,182 |
2575182.4516767 |
|
 George Kontos
 |
Kontos George |
RP |
$1,750,000 |
1750000 |
0.97% |
0.97 |
1.22 |
1.22265 |
0.70 |
0.69865714285714 |
$1,431,317 |
1431317.2207909 |
|
 Conor Gillaspie
 |
Gillaspie Conor |
PH |
$1,400,000 |
1400000 |
0.77% |
0.77 |
-0.27 |
-0.266354 |
— |
0 |
— |
0 |
|
 Cory Gearrin
 |
Gearrin Cory |
RP |
$1,050,000 |
1050000 |
0.58% |
0.58 |
-0.37 |
-0.366611 |
— |
0 |
— |
0 |
|
 Neil Ramírez
 |
Ramirez Neil |
RP |
$750,000 |
750000 |
0.41% |
0.41 |
0.17 |
0.166242 |
0.22 |
0.221656 |
$4,511,495 |
4511495.2899989 |
|
 Chris Marrero
 |
Marrero Chris |
LF |
$610,000 |
610000 |
0.34% |
0.34 |
-0.57 |
-0.565887 |
— |
0 |
— |
0 |
|
 Joe Panik
 |
Panik Joe |
2B |
$600,000 |
600000 |
0.33% |
0.33 |
1.89 |
1.88935 |
3.15 |
3.1489166666667 |
$317,570 |
317569.53449599 |
|
 Hunter Strickland
 |
Strickland Hunter |
RP |
$555,000 |
555000 |
0.31% |
0.31 |
0.04 |
0.0405647 |
0.07 |
0.07308954954955 |
$13,681,847 |
13681846.53159 |
|
 Derek Law
 |
Law Derek |
RP |
$545,000 |
545000 |
0.30% |
0.30 |
0.18 |
0.183095 |
0.34 |
0.33595412844037 |
$2,976,597 |
2976596.8486305 |
|
 Jarrett Parker
 |
Parker Jarrett |
LF |
$539,000 |
539000 |
0.30% |
0.30 |
0.63 |
0.629796 |
1.17 |
1.168452690167 |
$855,833 |
855832.68232888 |
|
 Mac Williamson
 |
Williamson Mac |
RF |
$539,000 |
539000 |
0.30% |
0.30 |
0.28 |
0.282741 |
0.52 |
0.52456586270872 |
$1,906,338 |
1906338.3096191 |
|
 Gorkys Hernández
 |
Hernandez Gorkys |
LF |
$537,000 |
537000 |
0.30% |
0.30 |
0.25 |
0.251982 |
0.47 |
0.46924022346369 |
$2,131,105 |
2131104.6027097 |
|
 Ty Blach
 |
Blach Ty |
SP |
$536,500 |
536500 |
0.30% |
0.30 |
2.12 |
2.12132 |
3.95 |
3.9539981360671 |
$252,909 |
252908.56636434 |
|
| Year | Giants payroll |
PR Sort |
Avg payroll |
AvgPR Sort |
Diff |
Diff Sort |
|---|
| 2000 | $53,342,826 | 53342826 | $57,491,092 | 57491092 | $-4,148,266 | -4148266 |
| 2001 | $63,289,167 | 63289167 | $67,120,750 | 67120750 | $-3,831,583 | -3831583 |
| 2002 | $78,514,835 | 78514835 | $69,204,705 | 69204705 | $9,310,130 | 9310130 |
| 2003 | $81,302,167 | 81302167 | $72,156,639 | 72156639 | $9,145,528 | 9145528 |
| 2004 | $80,400,833 | 80400833 | $71,426,357 | 71426357 | $8,974,476 | 8974476 |
| 2005 | $88,848,833 | 88848833 | $73,628,169 | 73628169 | $15,220,664 | 15220664 |
| 2006 | $90,017,671 | 90017671 | $81,192,832 | 81192832 | $8,824,839 | 8824839 |
| 2007 | $89,691,052 | 89691052 | $85,747,487 | 85747487 | $3,943,565 | 3943565 |
| 2008 | $75,877,000 | 75877000 | $93,079,041 | 93079041 | $-17,202,041 | -17202041 |
| 2009 | $82,566,450 | 82566450 | $92,957,049 | 92957049 | $-10,390,599 | -10390599 |
| 2010 | $97,023,833 | 97023833 | $94,957,956 | 94957956 | $2,065,877 | 2065877 |
| 2011 | $118,198,333 | 118198333 | $97,426,414 | 97426414 | $20,771,919 | 20771919 |
| 2012 | $131,980,298 | 131980298 | $100,689,500 | 100689500 | $31,290,798 | 31290798 |
| 2013 | $136,908,777 | 136908777 | $106,658,387 | 106658387 | $30,250,390 | 30250390 |
| 2014 | $149,439,474 | 149439474 | $115,428,670 | 115428670 | $34,010,804 | 34010804 |
| 2015 | $173,179,277 | 173179277 | $125,458,486 | 125458486 | $47,720,791 | 47720791 |
| 2016 | $172,086,611 | 172086611 | $130,290,910 | 130290910 | $41,795,701 | 41795701 |
| 2017 | $180,822,611 | 180822611 | $136,573,000 | 136573000 | $44,249,611 | 44249611 |
| 2018 | $200,505,278 | 200505278 | $135,681,867 | 135681867 | $64,823,411 | 64823411 |
| 2019 | $170,179,653 | 170179653 | $134,776,225 | 134776225 | $35,403,428 | 35403428 |
| 2020 | $155,190,747 | 155190747 | $138,321,485 | 138321485 | $16,869,262 | 16869262 |
| 2021 | $149,344,778 | 149344778 | $129,635,938 | 129635938 | $19,708,840 | 19708840 |
| 2022 | $166,189,000 | 166189000 | $147,002,411 | 147002411 | $19,186,589 | 19186589 |
| 2023 | $189,262,500 | 189262500 | $158,155,877 | 158155877 | $31,106,623 | 31106623 |
| 2024 | $189,387,903 | 189387903 | $133,074,721 | 133074721 | $56,313,182 | 56313182 |
| 2025 | $135,000,000 | 135000000 | $94,180,059 | 94180059 | $40,819,941 | 40819941 |
| 2026 | $93,750,000 | 93750000 | $74,818,461 | 74818461 | $18,931,539 | 18931539 |
| 2027 | $35,500,000 | 35500000 | $56,972,319 | 56972319 | $-21,472,319 | -21472319 |
| 2028 | $24,000,000 | 24000000 | $45,437,759 | 45437759 | $-21,437,759 | -21437759 |
|

 See something wrong? Please click
here
here to send us a correction (feedback form opens in a new browser tab).
 2017 San Francisco Giants


