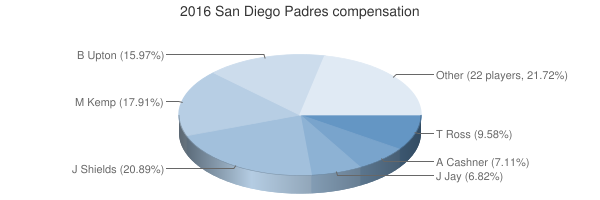
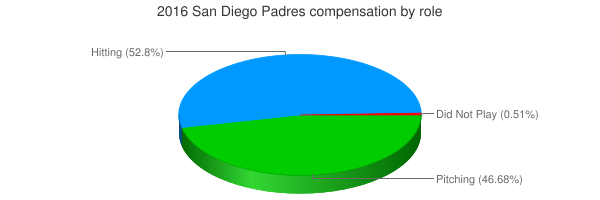
| Player | Player Sort | Pos | Salary | Salary Sort | Pct | Pct Sort | WARP | WARP Sort | WARP/$M | WARP/$M Sort | $/WARP | $/WARP Sort | Current Status |
|---|
 James Shields
 |
Shields James |
SP |
$21,000,000 |
21000000 |
20.89% |
20.89 |
0.75 |
0.748017 |
0.04 |
0.035619857142857 |
$28,074,228 |
28074228.259518 |
|
 Matt Kemp
 |
Kemp Matt |
RF |
$18,000,000 |
18000000 |
17.91% |
17.91 |
0.64 |
0.639506 |
0.04 |
0.035528111111111 |
$28,146,726 |
28146725.753941 |
|
 B.J. Upton
 |
Upton B.J. |
LF |
$16,050,000 |
16050000 |
15.97% |
15.97 |
2.09 |
2.09481 |
0.13 |
0.13051775700935 |
$7,661,793 |
7661792.7162845 |
|
 Tyson Ross
 |
Ross Tyson |
SP |
$9,625,000 |
9625000 |
9.58% |
9.58 |
0.10 |
0.0971226 |
0.01 |
0.01009065974026 |
$99,101,548 |
99101547.940438 |
|
 Andrew Cashner
 |
Cashner Andrew |
SP |
$7,150,000 |
7150000 |
7.11% |
7.11 |
-0.68 |
-0.67565 |
— |
0 |
— |
0 |
|
 Jon Jay
 |
Jay Jon |
CF |
$6,850,000 |
6850000 |
6.82% |
6.82 |
1.75 |
1.75095 |
0.26 |
0.25561313868613 |
$3,912,162 |
3912161.9692167 |
|
 Alexei Ramirez
 |
Ramirez Alexei |
SS |
$3,000,000 |
3000000 |
2.98% |
2.98 |
-0.87 |
-0.866093 |
— |
0 |
— |
0 |
|
 Derek Norris
 |
Norris Derek |
C |
$2,925,000 |
2925000 |
2.91% |
2.91 |
1.13 |
1.12991 |
0.39 |
0.38629401709402 |
$2,588,702 |
2588701.755007 |
|
 Matt Thornton
 |
Thornton Matt |
RP |
$1,600,000 |
1600000 |
1.59% |
1.59 |
-0.49 |
-0.49483 |
— |
0 |
— |
0 |
|
 Fernando Rodney
 |
Rodney Fernando |
RP |
$1,600,000 |
1600000 |
1.59% |
1.59 |
0.25 |
0.250483 |
0.16 |
0.156551875 |
$6,387,659 |
6387659.0427294 |
|
 Carlos Villanueva
 |
Villanueva Carlos |
RP |
$1,500,000 |
1500000 |
1.49% |
1.49 |
-0.82 |
-0.821044 |
— |
0 |
— |
0 |
|
 Drew Pomeranz
 |
Pomeranz Drew |
SP |
$1,350,000 |
1350000 |
1.34% |
1.34 |
2.61 |
2.60583 |
1.93 |
1.9302444444444 |
$518,069 |
518069.09890515 |
|
 Alexi Amarista
 |
Amarista Alexi |
2B |
$1,350,000 |
1350000 |
1.34% |
1.34 |
-0.44 |
-0.444296 |
— |
0 |
— |
0 |
|
 Brett Wallace
 |
Wallace Brett |
PH |
$1,000,000 |
1000000 |
0.99% |
0.99 |
-0.44 |
-0.435173 |
— |
0 |
— |
0 |
|
 Adam Rosales
 |
Rosales Adam |
3B |
$800,000 |
800000 |
0.80% |
0.80 |
1.95 |
1.95426 |
2.44 |
2.442825 |
$409,362 |
409362.11148977 |
|
 Brandon Maurer
 |
Maurer Brandon |
RP |
$526,400 |
526400 |
0.52% |
0.52 |
0.94 |
0.935254 |
1.78 |
1.7766983282675 |
$562,842 |
562841.75208018 |
|
 Yangervis Solarte
 |
Solarte Yangervis |
3B |
$525,500 |
525500 |
0.52% |
0.52 |
3.35 |
3.35396 |
6.38 |
6.3824167459562 |
$156,680 |
156680.46130544 |
|
 Wil Myers
 |
Myers Wil |
1B |
$523,900 |
523900 |
0.52% |
0.52 |
3.66 |
3.65984 |
6.99 |
6.9857606413438 |
$143,148 |
143148.33435341 |
|
 Kevin Quackenbush
 |
Quackenbush Kevin |
RP |
$521,200 |
521200 |
0.52% |
0.52 |
-0.13 |
-0.129967 |
— |
0 |
— |
0 |
|
 Ryan Buchter
 |
Buchter Ryan |
RP |
$520,000 |
520000 |
0.52% |
0.52 |
-0.46 |
-0.463896 |
— |
0 |
— |
0 |
|
 Buddy Baumann
 |
Baumann Buddy |
RP |
$520,000 |
520000 |
0.52% |
0.52 |
0.16 |
0.162636 |
0.31 |
0.31276153846154 |
$3,197,324 |
3197324.0856883 |
|
 Cory Spangenberg
 |
Spangenberg Cory |
2B |
$517,700 |
517700 |
0.52% |
0.52 |
0.02 |
0.0167375 |
0.03 |
0.032330500289743 |
$30,930,545 |
30930545.182972 |
|
 Christian Bethancourt
 |
Bethancourt Christian |
C |
$511,200 |
511200 |
0.51% |
0.51 |
0.19 |
0.188351 |
0.37 |
0.36844874804382 |
$2,714,082 |
2714081.6879125 |
|
 Colin Rea
 |
Rea Colin |
SP |
$510,200 |
510200 |
0.51% |
0.51 |
0.12 |
0.117033 |
0.23 |
0.22938651509212 |
$4,359,454 |
4359454.1710458 |
|
 Jon Edwards
 |
Edwards Jon |
DNP |
$509,600 |
509600 |
0.51% |
0.51 |
— |
0.00 |
— |
0 |
— |
0 |
|
 Travis Jankowski
 |
Jankowski Travis |
CF |
$508,800 |
508800 |
0.51% |
0.51 |
0.76 |
0.763265 |
1.50 |
1.5001277515723 |
$666,610 |
666609.89302536 |
|
 Jabari Blash
 |
Blash Jabari |
RF |
$507,500 |
507500 |
0.50% |
0.50 |
0.01 |
0.0145924 |
0.03 |
0.028753497536946 |
$34,778,378 |
34778377.785697 |
|
 Luis Perdomo
 |
Perdomo Luis |
SP |
$507,500 |
507500 |
0.50% |
0.50 |
0.02 |
0.0243885 |
0.05 |
0.048056157635468 |
$20,808,988 |
20808987.842631 |
|
| Year | Padres payroll |
PR Sort |
Avg payroll |
AvgPR Sort |
Diff |
Diff Sort |
|---|
| 1996 | $2,000,000 | 2000000 | $4,583,416 | 4583416 | $-2,583,416 | -2583416 |
| 1997 | $2,000,000 | 2000000 | $4,892,222 | 4892222 | $-2,892,222 | -2892222 |
| 2000 | $53,816,000 | 53816000 | $57,491,092 | 57491092 | $-3,675,092 | -3675092 |
| 2001 | $37,438,000 | 37438000 | $67,120,750 | 67120750 | $-29,682,750 | -29682750 |
| 2002 | $40,678,000 | 40678000 | $69,204,705 | 69204705 | $-28,526,705 | -28526705 |
| 2003 | $43,565,000 | 43565000 | $72,156,639 | 72156639 | $-28,591,639 | -28591639 |
| 2004 | $59,172,333 | 59172333 | $71,426,357 | 71426357 | $-12,254,024 | -12254024 |
| 2005 | $62,186,333 | 62186333 | $73,628,169 | 73628169 | $-11,441,836 | -11441836 |
| 2006 | $69,170,167 | 69170167 | $81,192,832 | 81192832 | $-12,022,665 | -12022665 |
| 2007 | $58,571,067 | 58571067 | $85,747,487 | 85747487 | $-27,176,420 | -27176420 |
| 2008 | $74,010,117 | 74010117 | $93,079,041 | 93079041 | $-19,068,924 | -19068924 |
| 2009 | $44,173,200 | 44173200 | $92,957,049 | 92957049 | $-48,783,849 | -48783849 |
| 2010 | $37,799,300 | 37799300 | $94,957,956 | 94957956 | $-57,158,656 | -57158656 |
| 2011 | $45,869,140 | 45869140 | $97,426,414 | 97426414 | $-51,557,274 | -51557274 |
| 2012 | $55,621,900 | 55621900 | $100,689,500 | 100689500 | $-45,067,600 | -45067600 |
| 2013 | $68,333,600 | 68333600 | $106,658,387 | 106658387 | $-38,324,787 | -38324787 |
| 2014 | $90,636,600 | 90636600 | $115,428,670 | 115428670 | $-24,792,070 | -24792070 |
| 2015 | $108,387,033 | 108387033 | $125,458,486 | 125458486 | $-17,071,453 | -17071453 |
| 2016 | $100,509,500 | 100509500 | $130,290,910 | 130290910 | $-29,781,410 | -29781410 |
| 2017 | $67,624,400 | 67624400 | $136,573,000 | 136573000 | $-68,948,600 | -68948600 |
| 2018 | $94,037,733 | 94037733 | $135,681,867 | 135681867 | $-41,644,134 | -41644134 |
| 2019 | $100,804,100 | 100804100 | $134,776,225 | 134776225 | $-33,972,125 | -33972125 |
| 2020 | $151,461,550 | 151461550 | $138,321,485 | 138321485 | $13,140,065 | 13140065 |
| 2021 | $171,488,220 | 171488220 | $129,635,938 | 129635938 | $41,852,282 | 41852282 |
| 2022 | $212,846,719 | 212846719 | $147,002,411 | 147002411 | $65,844,308 | 65844308 |
| 2023 | $221,599,740 | 221599740 | $158,155,877 | 158155877 | $63,443,863 | 63443863 |
| 2024 | $153,892,054 | 153892054 | $133,074,721 | 133074721 | $20,817,333 | 20817333 |
| 2025 | $150,295,454 | 150295454 | $94,180,059 | 94180059 | $56,115,395 | 56115395 |
| 2026 | $137,745,454 | 137745454 | $74,818,461 | 74818461 | $62,926,993 | 62926993 |
| 2027 | $156,495,454 | 156495454 | $56,972,319 | 56972319 | $99,523,135 | 99523135 |
| 2028 | $124,545,454 | 124545454 | $45,437,759 | 45437759 | $79,107,695 | 79107695 |
| 2029 | $113,545,454 | 113545454 | $37,269,628 | 37269628 | $76,275,826 | 76275826 |
| 2030 | $113,545,454 | 113545454 | $39,665,769 | 39665769 | $73,879,685 | 73879685 |
| 2031 | $101,259,739 | 101259739 | $38,360,152 | 38360152 | $62,899,587 | 62899587 |
| 2032 | $101,259,739 | 101259739 | $47,925,459 | 47925459 | $53,334,280 | 53334280 |
| 2033 | $101,259,739 | 101259739 | $43,068,924 | 43068924 | $58,190,815 | 58190815 |
| 2034 | $36,714,285 | 36714285 | $29,428,571 | 29428571 | $7,285,714 | 7285714 |
|

 See something wrong? Please click
here
here to send us a correction (feedback form opens in a new browser tab).
 2016 San Diego Padres


