| Player | Player Sort | Pos | Salary | Salary Sort | Pct | Pct Sort | WARP | WARP Sort | WARP/$M | WARP/$M Sort | $/WARP | $/WARP Sort | Current Status |
|---|
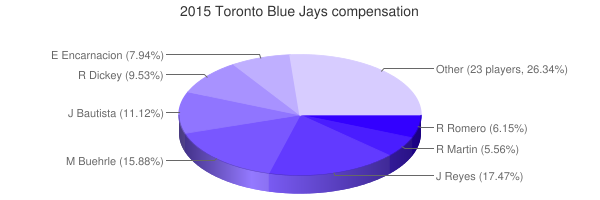
 José Reyes
 |
Reyes Jose |
SS |
$22,000,000 |
22000000 |
17.47% |
17.47 |
0.93 |
0.926176 |
0.04 |
0.042098909090909 |
$23,753,585 |
23753584.631863 |
|
 Mark Buehrle
 |
Buehrle Mark |
RP |
$20,000,000 |
20000000 |
15.88% |
15.88 |
0.83 |
0.831678 |
0.04 |
0.0415839 |
$24,047,768 |
24047768.487323 |
|
 José Bautista
 |
Bautista Jose |
RF |
$14,000,000 |
14000000 |
11.12% |
11.12 |
4.14 |
4.14123 |
0.30 |
0.29580214285714 |
$3,380,638 |
3380638.1195925 |
|
 R.A. Dickey
 |
Dickey R.A. |
RP |
$12,000,000 |
12000000 |
9.53% |
9.53 |
3.77 |
3.77427 |
0.31 |
0.3145225 |
$3,179,423 |
3179422.7757951 |
|
 Edwin Encarnación
 |
Encarnacion Edwin |
DH |
$10,000,000 |
10000000 |
7.94% |
7.94 |
4.31 |
4.31252 |
0.43 |
0.431252 |
$2,318,830 |
2318829.8257168 |
|
 Ricky Romero
 |
Romero Ricky |
DNP |
$7,750,000 |
7750000 |
6.15% |
6.15 |
— |
0.00 |
— |
0 |
— |
0 |
|
 Russell Martin
 |
Martin Russell |
C |
$7,000,000 |
7000000 |
5.56% |
5.56 |
4.12 |
4.12403 |
0.59 |
0.58914714285714 |
$1,697,369 |
1697368.8358232 |
|
 Dioner Navarro
 |
Navarro Dioner |
C |
$5,000,000 |
5000000 |
3.97% |
3.97 |
0.26 |
0.261385 |
0.05 |
0.052277 |
$19,128,871 |
19128871.20531 |
|
 Josh Donaldson
 |
Donaldson Josh |
3B |
$4,300,000 |
4300000 |
3.41% |
3.41 |
7.07 |
7.0716 |
1.64 |
1.6445581395349 |
$608,066 |
608066.06708524 |
|
 Marco Estrada
 |
Estrada Marco |
RP |
$3,900,000 |
3900000 |
3.10% |
3.10 |
0.88 |
0.877525 |
0.23 |
0.22500641025641 |
$4,444,318 |
4444317.825703 |
|
 Maicer Izturis
 |
Izturis Maicer |
DNP |
$3,000,000 |
3000000 |
2.38% |
2.38 |
— |
0.00 |
— |
0 |
— |
0 |
|
 Michael Saunders
 |
Saunders Michael |
RF |
$2,875,000 |
2875000 |
2.28% |
2.28 |
-0.09 |
-0.0929423 |
— |
0 |
— |
0 |
|
 Brett Cecil
 |
Cecil Brett |
RP |
$2,475,000 |
2475000 |
1.97% |
1.97 |
1.32 |
1.32144 |
0.53 |
0.53391515151515 |
$1,872,957 |
1872956.7744279 |
|
 Josh Thole
 |
Thole Josh |
C |
$1,750,000 |
1750000 |
1.39% |
1.39 |
-0.02 |
-0.0155554 |
— |
0 |
— |
0 |
|
 Danny Valencia
 |
Valencia Danny |
LF |
$1,675,000 |
1675000 |
1.33% |
1.33 |
0.35 |
0.353081 |
0.21 |
0.21079462686567 |
$4,743,954 |
4743953.9369153 |
|
 Justin Smoak
 |
Smoak Justin |
1B |
$1,000,000 |
1000000 |
0.79% |
0.79 |
0.46 |
0.457975 |
0.46 |
0.457975 |
$2,183,525 |
2183525.3015994 |
|
 Aaron Loup
 |
Loup Aaron |
RP |
$527,000 |
527000 |
0.42% |
0.42 |
0.72 |
0.715385 |
1.36 |
1.3574667931689 |
$736,666 |
736666.27060953 |
|
 Drew Hutchison
 |
Hutchison Drew |
RP |
$520,100 |
520100 |
0.41% |
0.41 |
-0.40 |
-0.403202 |
— |
0 |
— |
0 |
|
 Todd Redmond
 |
Redmond Todd |
RP |
$520,000 |
520000 |
0.41% |
0.41 |
-0.14 |
-0.13655 |
— |
0 |
— |
0 |
|
 Liam Hendriks
 |
Hendriks Liam |
RP |
$518,400 |
518400 |
0.41% |
0.41 |
1.57 |
1.56654 |
3.02 |
3.021875 |
$330,920 |
330920.37228542 |
|
 Steve Tolleson
 |
Tolleson Steve |
2B |
$517,300 |
517300 |
0.41% |
0.41 |
0.21 |
0.207564 |
0.40 |
0.4012449255751 |
$2,492,243 |
2492243.356266 |
|
 Marcus Stroman
 |
Stroman Marcus |
RP |
$514,700 |
514700 |
0.41% |
0.41 |
0.34 |
0.336426 |
0.65 |
0.6536351272586 |
$1,529,906 |
1529905.536433 |
|
 Kevin Pillar
 |
Pillar Kevin |
CF |
$512,000 |
512000 |
0.41% |
0.41 |
3.55 |
3.551 |
6.94 |
6.935546875 |
$144,185 |
144184.73669389 |
|
 Aaron Sanchez
 |
Sanchez Aaron |
RP |
$510,800 |
510800 |
0.41% |
0.41 |
-0.16 |
-0.160348 |
— |
0 |
— |
0 |
|
 Colt Hynes
 |
Hynes Colt |
RP |
$510,800 |
510800 |
0.41% |
0.41 |
0.05 |
0.0540705 |
0.11 |
0.10585454189507 |
$9,446,926 |
9446925.7728336 |
|
 Daniel Norris
 |
Norris Daniel |
RP |
$508,700 |
508700 |
0.40% |
0.40 |
0.47 |
0.465511 |
0.92 |
0.91509927265579 |
$1,092,778 |
1092777.6142776 |
|
 Dalton Pompey
 |
Pompey Dalton |
CF |
$508,500 |
508500 |
0.40% |
0.40 |
-0.03 |
-0.0302831 |
— |
0 |
— |
0 |
|
 Miguel Castro
 |
Castro Miguel |
RP |
$507,500 |
507500 |
0.40% |
0.40 |
0.20 |
0.200512 |
0.40 |
0.39509753694581 |
$2,531,021 |
2531020.5872965 |
|
 Roberto Osuna
 |
Osuna Roberto |
RP |
$507,500 |
507500 |
0.40% |
0.40 |
1.57 |
1.56846 |
3.09 |
3.0905615763547 |
$323,566 |
323565.79064815 |
|
 Devon Travis
 |
Travis Devon |
2B |
$507,500 |
507500 |
0.40% |
0.40 |
1.84 |
1.83537 |
3.62 |
3.6164926108374 |
$276,511 |
276511.00323096 |
|
| Year | Blue Jays payroll |
PR Sort |
Avg payroll |
AvgPR Sort |
Diff |
Diff Sort |
|---|
| 2000 | $45,518,332 | 45518332 | $57,491,092 | 57491092 | $-11,972,760 | -11972760 |
| 2001 | $76,322,999 | 76322999 | $67,120,750 | 67120750 | $9,202,249 | 9202249 |
| 2002 | $76,464,333 | 76464333 | $69,204,705 | 69204705 | $7,259,628 | 7259628 |
| 2003 | $49,679,000 | 49679000 | $72,156,639 | 72156639 | $-22,477,639 | -22477639 |
| 2004 | $49,018,000 | 49018000 | $71,426,357 | 71426357 | $-22,408,357 | -22408357 |
| 2005 | $45,801,500 | 45801500 | $73,628,169 | 73628169 | $-27,826,669 | -27826669 |
| 2006 | $69,295,000 | 69295000 | $81,192,832 | 81192832 | $-11,897,832 | -11897832 |
| 2007 | $84,315,000 | 84315000 | $85,747,487 | 85747487 | $-1,432,487 | -1432487 |
| 2008 | $104,368,800 | 104368800 | $93,079,041 | 93079041 | $11,289,759 | 11289759 |
| 2009 | $81,842,100 | 81842100 | $92,957,049 | 92957049 | $-11,114,949 | -11114949 |
| 2010 | $76,189,000 | 76189000 | $94,957,956 | 94957956 | $-18,768,956 | -18768956 |
| 2011 | $70,317,800 | 70317800 | $97,426,414 | 97426414 | $-27,108,614 | -27108614 |
| 2012 | $83,739,200 | 83739200 | $100,689,500 | 100689500 | $-16,950,300 | -16950300 |
| 2013 | $127,777,800 | 127777800 | $106,658,387 | 106658387 | $21,119,413 | 21119413 |
| 2014 | $137,177,700 | 137177700 | $115,428,670 | 115428670 | $21,749,030 | 21749030 |
| 2015 | $125,915,800 | 125915800 | $125,458,486 | 125458486 | $457,314 | 457314 |
| 2016 | $136,782,027 | 136782027 | $130,290,910 | 130290910 | $6,491,117 | 6491117 |
| 2017 | $163,381,937 | 163381937 | $136,573,000 | 136573000 | $26,808,937 | 26808937 |
| 2018 | $162,037,223 | 162037223 | $135,681,867 | 135681867 | $26,355,356 | 26355356 |
| 2019 | $117,546,171 | 117546171 | $134,776,225 | 134776225 | $-17,230,054 | -17230054 |
| 2020 | $108,987,471 | 108987471 | $138,321,485 | 138321485 | $-29,334,014 | -29334014 |
| 2021 | $140,375,671 | 140375671 | $129,635,938 | 129635938 | $10,739,733 | 10739733 |
| 2022 | $166,851,121 | 166851121 | $147,002,411 | 147002411 | $19,848,710 | 19848710 |
| 2023 | $186,938,983 | 186938983 | $158,155,877 | 158155877 | $28,783,106 | 28783106 |
| 2024 | $181,399,600 | 181399600 | $133,074,721 | 133074721 | $48,324,879 | 48324879 |
| 2025 | $130,750,000 | 130750000 | $94,180,059 | 94180059 | $36,569,941 | 36569941 |
| 2026 | $95,166,667 | 95166667 | $74,818,461 | 74818461 | $20,348,206 | 20348206 |
| 2027 | $30,000,000 | 30000000 | $56,972,319 | 56972319 | $-26,972,319 | -26972319 |
| 2028 | $30,000,000 | 30000000 | $45,437,759 | 45437759 | $-15,437,759 | -15437759 |
|

 See something wrong? Please click
here
here to send us a correction (feedback form opens in a new browser tab).
 2015 Toronto Blue Jays


