| Player | Player Sort | Pos | Salary | Salary Sort | Pct | Pct Sort | WARP | WARP Sort | WARP/$M | WARP/$M Sort | $/WARP | $/WARP Sort | Current Status |
|---|
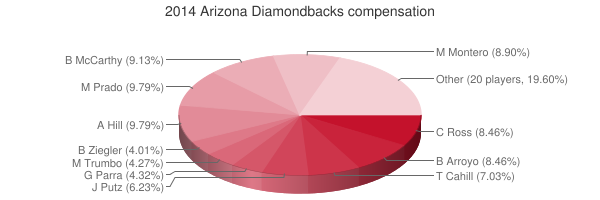
 Aaron Hill
 |
Hill Aaron |
2B |
$11,000,000 |
11000000 |
9.79% |
9.79 |
0.05 |
0.0533056 |
0.00 |
0.0048459636363636 |
$206,357,306 |
206357305.79902 |
|
 Martín Prado
 |
Prado Martin |
3B |
$11,000,000 |
11000000 |
9.79% |
9.79 |
-0.06 |
-0.0576968 |
— |
0 |
— |
0 |
|
 Brandon McCarthy
 |
McCarthy Brandon |
RP |
$10,250,000 |
10250000 |
9.13% |
9.13 |
1.77 |
1.77207 |
0.17 |
0.17288487804878 |
$5,784,196 |
5784195.8839098 |
|
 Miguel Montero
 |
Montero Miguel |
C |
$10,000,000 |
10000000 |
8.90% |
8.90 |
3.58 |
3.58052 |
0.36 |
0.358052 |
$2,792,890 |
2792890.4181516 |
|
 Bronson Arroyo
 |
Arroyo Bronson |
RP |
$9,500,000 |
9500000 |
8.46% |
8.46 |
0.17 |
0.171627 |
0.02 |
0.018066 |
$55,352,596 |
55352596.036754 |
|
 Cody Ross
 |
Ross Cody |
LF |
$9,500,000 |
9500000 |
8.46% |
8.46 |
-0.64 |
-0.63751 |
— |
0 |
— |
0 |
|
 Trevor Cahill
 |
Cahill Trevor |
RP |
$7,900,000 |
7900000 |
7.03% |
7.03 |
-0.24 |
-0.239428 |
— |
0 |
— |
0 |
|
 J.J. Putz
 |
Putz J.J. |
RP |
$7,000,000 |
7000000 |
6.23% |
6.23 |
0.01 |
0.009769 |
0.00 |
0.0013955714285714 |
$716,552,360 |
716552359.50456 |
|
 Gerardo Parra
 |
Parra Gerardo |
RF |
$4,850,000 |
4850000 |
4.32% |
4.32 |
0.46 |
0.457043 |
0.09 |
0.094235670103093 |
$10,611,693 |
10611692.991688 |
|
 Mark Trumbo
 |
Trumbo Mark |
1B |
$4,800,000 |
4800000 |
4.27% |
4.27 |
-0.49 |
-0.493453 |
— |
0 |
— |
0 |
|
 Brad Ziegler
 |
Ziegler Brad |
RP |
$4,500,000 |
4500000 |
4.01% |
4.01 |
0.05 |
0.0527982 |
0.01 |
0.011732933333333 |
$85,230,178 |
85230178.301533 |
|
 Eric Chavez
 |
Chavez Eric |
PH |
$3,500,000 |
3500000 |
3.12% |
3.12 |
0.46 |
0.456342 |
0.13 |
0.13038342857143 |
$7,669,686 |
7669686.3317424 |
|
 Cliff Pennington
 |
Pennington Cliff |
SS |
$3,250,000 |
3250000 |
2.89% |
2.89 |
1.05 |
1.05243 |
0.32 |
0.32382461538462 |
$3,088,091 |
3088091.3694973 |
|
 Joe Thatcher
 |
Thatcher Joe |
RP |
$2,375,000 |
2375000 |
2.11% |
2.11 |
0.17 |
0.165197 |
0.07 |
0.069556631578947 |
$14,376,774 |
14376774.396629 |
|
 David Hernandez
 |
Hernandez David |
DNP |
$2,125,000 |
2125000 |
1.89% |
1.89 |
— |
0.00 |
— |
0 |
— |
0 |
|
 Oliver Pérez
 |
Perez Oliver |
RP |
$1,750,000 |
1750000 |
1.56% |
1.56 |
0.59 |
0.591938 |
0.34 |
0.33825028571429 |
$2,956,391 |
2956390.7030804 |
|
 Paul Goldschmidt
 |
Goldschmidt Paul |
1B |
$1,100,000 |
1100000 |
0.98% |
0.98 |
4.60 |
4.60079 |
4.18 |
4.1825363636364 |
$239,089 |
239089.37378146 |
|
 Josh Collmenter
 |
Collmenter Josh |
RP |
$975,000 |
975000 |
0.87% |
0.87 |
2.09 |
2.09293 |
2.15 |
2.1465948717949 |
$465,854 |
465854.08972111 |
|
 Daniel Hudson
 |
Hudson Daniel |
RP |
$700,000 |
700000 |
0.62% |
0.62 |
0.01 |
0.00816648 |
0.01 |
0.0116664 |
$85,716,245 |
85716244.942742 |
|
 Ryan Rowland-Smith
 |
Rowland-Smith Ryan |
RP |
$575,000 |
575000 |
0.51% |
0.51 |
0.07 |
0.0709016 |
0.12 |
0.12330713043478 |
$8,109,831 |
8109831.0898485 |
|
 Matt Reynolds
 |
Reynolds Matt |
DNP |
$550,000 |
550000 |
0.49% |
0.49 |
— |
0.00 |
— |
0 |
— |
0 |
|
 Addison Reed
 |
Reed Addison |
RP |
$538,500 |
538500 |
0.48% |
0.48 |
-0.51 |
-0.509331 |
— |
0 |
— |
0 |
|
 Wade Miley
 |
Miley Wade |
RP |
$523,500 |
523500 |
0.47% |
0.47 |
2.08 |
2.07746 |
3.97 |
3.9684049665712 |
$251,990 |
251990.41136773 |
|
 Patrick Corbin
 |
Corbin Patrick |
DNP |
$515,000 |
515000 |
0.46% |
0.46 |
— |
0.00 |
— |
0 |
— |
0 |
|
 Will Harris
 |
Harris Will |
RP |
$510,000 |
510000 |
0.45% |
0.45 |
0.56 |
0.558665 |
1.10 |
1.0954215686275 |
$912,891 |
912890.55158279 |
|
 Randall Delgado
 |
Delgado Randall |
RP |
$510,000 |
510000 |
0.45% |
0.45 |
0.04 |
0.0358367 |
0.07 |
0.070268039215686 |
$14,231,221 |
14231221.066672 |
|
 Tony Campana
 |
Campana Tony |
CF |
$509,500 |
509500 |
0.45% |
0.45 |
-0.54 |
-0.541809 |
— |
0 |
— |
0 |
|
 AJ Pollock
 |
Pollock AJ |
CF |
$507,000 |
507000 |
0.45% |
0.45 |
2.19 |
2.191 |
4.32 |
4.3214990138067 |
$231,401 |
231401.18667275 |
|
 Tuffy Gosewisch
 |
Gosewisch Tuffy |
C |
$502,000 |
502000 |
0.45% |
0.45 |
0.06 |
0.0556144 |
0.11 |
0.11078565737052 |
$9,026,439 |
9026439.195604 |
|
 Heath Bell
 |
Bell Heath |
DNP |
$500,000 |
500000 |
0.45% |
0.45 |
— |
0.00 |
— |
0 |
— |
0 |
|
 Chris Owings
 |
Owings Chris |
SS |
$500,000 |
500000 |
0.45% |
0.45 |
0.21 |
0.211624 |
0.42 |
0.423248 |
$2,362,681 |
2362680.9813632 |
|
| Year | Diamondbacks payroll |
PR Sort |
Avg payroll |
AvgPR Sort |
Diff |
Diff Sort |
|---|
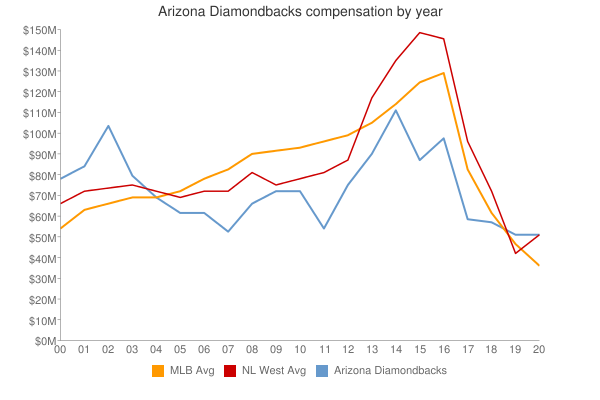
| 1999 | $8,600,000 | 8600000 | $7,867,823 | 7867823 | $732,177 | 732177 |
| 2000 | $78,869,333 | 78869333 | $57,491,092 | 57491092 | $21,378,241 | 21378241 |
| 2001 | $85,080,499 | 85080499 | $67,120,750 | 67120750 | $17,959,749 | 17959749 |
| 2002 | $104,517,499 | 104517499 | $69,204,705 | 69204705 | $35,312,794 | 35312794 |
| 2003 | $80,557,000 | 80557000 | $72,156,639 | 72156639 | $8,400,361 | 8400361 |
| 2004 | $69,935,750 | 69935750 | $71,426,357 | 71426357 | $-1,490,607 | -1490607 |
| 2005 | $62,413,833 | 62413833 | $73,628,169 | 73628169 | $-11,214,336 | -11214336 |
| 2006 | $62,073,898 | 62073898 | $81,192,832 | 81192832 | $-19,118,934 | -19118934 |
| 2007 | $52,402,000 | 52402000 | $85,747,487 | 85747487 | $-33,345,487 | -33345487 |
| 2008 | $66,138,000 | 66138000 | $93,079,041 | 93079041 | $-26,941,041 | -26941041 |
| 2009 | $73,375,000 | 73375000 | $92,957,049 | 92957049 | $-19,582,049 | -19582049 |
| 2010 | $71,984,833 | 71984833 | $94,957,956 | 94957956 | $-22,973,123 | -22973123 |
| 2011 | $55,889,833 | 55889833 | $97,426,414 | 97426414 | $-41,536,581 | -41536581 |
| 2012 | $75,908,166 | 75908166 | $100,689,500 | 100689500 | $-24,781,334 | -24781334 |
| 2013 | $90,300,500 | 90300500 | $106,658,387 | 106658387 | $-16,357,887 | -16357887 |
| 2014 | $112,315,500 | 112315500 | $115,428,670 | 115428670 | $-3,113,170 | -3113170 |
| 2015 | $88,187,000 | 88187000 | $125,458,486 | 125458486 | $-37,271,486 | -37271486 |
| 2016 | $98,172,683 | 98172683 | $130,290,910 | 130290910 | $-32,118,227 | -32118227 |
| 2017 | $93,120,200 | 93120200 | $136,573,000 | 136573000 | $-43,452,800 | -43452800 |
| 2018 | $131,965,116 | 131965116 | $135,681,867 | 135681867 | $-3,716,751 | -3716751 |
| 2019 | $123,815,766 | 123815766 | $134,776,225 | 134776225 | $-10,960,459 | -10960459 |
| 2020 | $121,918,000 | 121918000 | $138,321,485 | 138321485 | $-16,403,485 | -16403485 |
| 2021 | $96,423,700 | 96423700 | $129,635,938 | 129635938 | $-33,212,238 | -33212238 |
| 2022 | $89,856,200 | 89856200 | $147,002,411 | 147002411 | $-57,146,211 | -57146211 |
| 2023 | $113,296,972 | 113296972 | $158,155,877 | 158155877 | $-44,858,905 | -44858905 |
| 2024 | $122,750,715 | 122750715 | $133,074,721 | 133074721 | $-10,324,006 | -10324006 |
| 2025 | $63,475,000 | 63475000 | $94,180,059 | 94180059 | $-30,705,059 | -30705059 |
| 2026 | $61,225,000 | 61225000 | $74,818,461 | 74818461 | $-13,593,461 | -13593461 |
| 2027 | $51,225,000 | 51225000 | $56,972,319 | 56972319 | $-5,747,319 | -5747319 |
| 2028 | $23,625,000 | 23625000 | $45,437,759 | 45437759 | $-21,812,759 | -21812759 |
| 2029 | $28,625,000 | 28625000 | $37,269,628 | 37269628 | $-8,644,628 | -8644628 |
| 2030 | $28,625,000 | 28625000 | $39,665,769 | 39665769 | $-11,040,769 | -11040769 |
| 2031 | $5,000,000 | 5000000 | $38,360,152 | 38360152 | $-33,360,152 | -33360152 |
|

 See something wrong? Please click
here
here to send us a correction (feedback form opens in a new browser tab).
 2014 Arizona Diamondbacks


