| Player | Player Sort | Pos | Salary | Salary Sort | Pct | Pct Sort | WARP | WARP Sort | WARP/$M | WARP/$M Sort | $/WARP | $/WARP Sort | Current Status |
|---|
 James Shields
 |
Shields James |
RP |
$7,500,000 |
7500000 |
11.79% |
11.79 |
4.53 |
4.5303 |
0.60 |
0.60404 |
$1,655,520 |
1655519.5020197 |
|
 Carlos Pena
 |
Pena Carlos |
1B |
$7,250,000 |
7250000 |
11.39% |
11.39 |
0.09 |
0.0941543 |
0.01 |
0.0129868 |
$77,001,263 |
77001262.82071 |
|
 B.J. Upton
 |
Upton B.J. |
CF |
$7,000,000 |
7000000 |
11.00% |
11.00 |
2.49 |
2.49041 |
0.36 |
0.35577285714286 |
$2,810,782 |
2810782.1603672 |
|
 Luke Scott
 |
Scott Luke |
DH |
$5,000,000 |
5000000 |
7.86% |
7.86 |
0.27 |
0.273376 |
0.05 |
0.0546752 |
$18,289,828 |
18289827.929299 |
|
 Ben Zobrist
 |
Zobrist Ben |
RF |
$4,640,475 |
4640475 |
7.29% |
7.29 |
4.95 |
4.9459 |
1.07 |
1.0658176156536 |
$938,247 |
938246.83070826 |
|
 Evan Longoria
 |
Longoria Evan |
3B |
$4,500,000 |
4500000 |
7.07% |
7.07 |
2.48 |
2.47756 |
0.55 |
0.55056888888889 |
$1,816,303 |
1816303.1369573 |
|
 David Price
 |
Price David |
RP |
$4,350,000 |
4350000 |
6.84% |
6.84 |
6.25 |
6.25084 |
1.44 |
1.4369747126437 |
$695,906 |
695906.47017041 |
|
 Kyle Farnsworth
 |
Farnsworth Kyle |
RP |
$3,300,000 |
3300000 |
5.19% |
5.19 |
-0.05 |
-0.0484017 |
— |
0 |
— |
0 |
|
 Jeff Niemann
 |
Niemann Jeff |
RP |
$2,750,000 |
2750000 |
4.32% |
4.32 |
0.61 |
0.609884 |
0.22 |
0.221776 |
$4,509,054 |
4509054.180795 |
|
 Joel Peralta
 |
Peralta Joel |
RP |
$2,175,000 |
2175000 |
3.42% |
3.42 |
1.64 |
1.64435 |
0.76 |
0.75602298850575 |
$1,322,711 |
1322711.1016511 |
|
 Fernando Rodney
 |
Rodney Fernando |
RP |
$1,750,000 |
1750000 |
2.75% |
2.75 |
2.22 |
2.21642 |
1.27 |
1.2665257142857 |
$789,562 |
789561.5451945 |
|
 Jeff Keppinger
 |
Keppinger Jeff |
3B |
$1,525,000 |
1525000 |
2.40% |
2.40 |
2.30 |
2.29729 |
1.51 |
1.5064196721311 |
$663,826 |
663825.63803438 |
|
 Wade Davis
 |
Davis Wade |
RP |
$1,500,000 |
1500000 |
2.36% |
2.36 |
1.94 |
1.94335 |
1.30 |
1.2955666666667 |
$771,863 |
771863.02004271 |
|
 José Molina
 |
Molina Jose |
C |
$1,500,000 |
1500000 |
2.36% |
2.36 |
2.92 |
2.91825 |
1.95 |
1.9455 |
$514,007 |
514006.68208687 |
|
 J.P. Howell
 |
Howell J.P. |
RP |
$1,350,000 |
1350000 |
2.12% |
2.12 |
-0.14 |
-0.137341 |
— |
0 |
— |
0 |
|
 Matt Moore
 |
Moore Matt |
RP |
$1,100,000 |
1100000 |
1.73% |
1.73 |
2.90 |
2.89841 |
2.63 |
2.6349181818182 |
$379,518 |
379518.42561956 |
|
 Burke Badenhop
 |
Badenhop Burke |
RP |
$1,075,000 |
1075000 |
1.69% |
1.69 |
0.32 |
0.321836 |
0.30 |
0.2993823255814 |
$3,340,211 |
3340210.5420152 |
|
 Matt Joyce
 |
Joyce Matt |
RF |
$499,500 |
499500 |
0.79% |
0.79 |
1.12 |
1.12053 |
2.24 |
2.2433033033033 |
$445,771 |
445771.1975583 |
|
 Sean Rodríguez
 |
Rodriguez Sean |
3B |
$492,800 |
492800 |
0.77% |
0.77 |
0.78 |
0.783703 |
1.59 |
1.5903064123377 |
$628,810 |
628809.63834514 |
|
 Reid Brignac
 |
Brignac Reid |
SS |
$490,600 |
490600 |
0.77% |
0.77 |
-0.24 |
-0.240286 |
— |
0 |
— |
0 |
|
 Jeremy Hellickson
 |
Hellickson Jeremy |
RP |
$489,500 |
489500 |
0.77% |
0.77 |
1.05 |
1.04953 |
2.14 |
2.1440858018386 |
$466,399 |
466399.2453765 |
|
 Sam Fuld
 |
Fuld Sam |
RF |
$489,400 |
489400 |
0.77% |
0.77 |
-0.06 |
-0.0569567 |
— |
0 |
— |
0 |
|
 Desmond Jennings
 |
Jennings Desmond |
LF |
$486,900 |
486900 |
0.77% |
0.77 |
2.20 |
2.20239 |
4.52 |
4.5232902033272 |
$221,078 |
221078.01070655 |
|
 Elliot Johnson
 |
Johnson Elliot |
SS |
$486,100 |
486100 |
0.76% |
0.76 |
0.64 |
0.639986 |
1.32 |
1.3165727216622 |
$759,548 |
759547.86510955 |
|
 Jake McGee
 |
McGee Jake |
RP |
$484,200 |
484200 |
0.76% |
0.76 |
1.54 |
1.54012 |
3.18 |
3.1807517554729 |
$314,391 |
314391.08640885 |
|
 Jose Lobaton
 |
Lobaton Jose |
C |
$481,500 |
481500 |
0.76% |
0.76 |
0.61 |
0.605901 |
1.26 |
1.2583613707165 |
$794,684 |
794684.28010517 |
|
 Robinson Chirinos
 |
Chirinos Robinson |
DNP |
$480,700 |
480700 |
0.76% |
0.76 |
— |
0.00 |
— |
0 |
— |
0 |
|
 Stephen Vogt
 |
Vogt Stephen |
PH |
$480,000 |
480000 |
0.75% |
0.75 |
-0.57 |
-0.572086 |
— |
0 |
— |
0 |
|
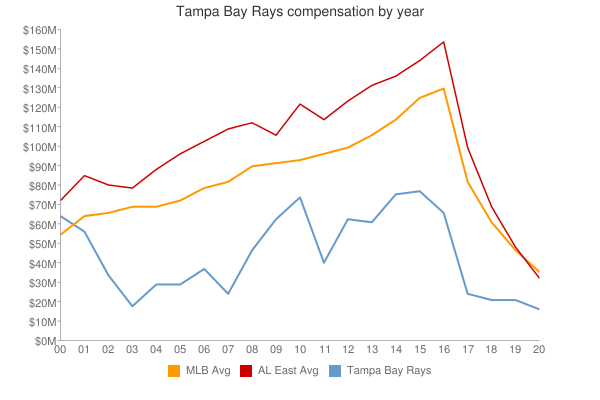
| Year | Rays payroll |
PR Sort |
Avg payroll |
AvgPR Sort |
Diff |
Diff Sort |
|---|
| 2000 | $62,815,129 | 62815129 | $57,491,092 | 57491092 | $5,324,037 | 5324037 |
| 2001 | $56,725,000 | 56725000 | $67,120,750 | 67120750 | $-10,395,750 | -10395750 |
| 2002 | $34,380,000 | 34380000 | $69,204,705 | 69204705 | $-34,824,705 | -34824705 |
| 2003 | $19,130,000 | 19130000 | $72,156,639 | 72156639 | $-53,026,639 | -53026639 |
| 2004 | $29,754,167 | 29754167 | $71,426,357 | 71426357 | $-41,672,190 | -41672190 |
| 2005 | $30,445,567 | 30445567 | $73,628,169 | 73628169 | $-43,182,602 | -43182602 |
| 2006 | $38,319,967 | 38319967 | $81,192,832 | 81192832 | $-42,872,865 | -42872865 |
| 2007 | $25,790,800 | 25790800 | $85,747,487 | 85747487 | $-59,956,687 | -59956687 |
| 2008 | $47,124,500 | 47124500 | $93,079,041 | 93079041 | $-45,954,541 | -45954541 |
| 2009 | $65,401,368 | 65401368 | $92,957,049 | 92957049 | $-27,555,681 | -27555681 |
| 2010 | $74,487,608 | 74487608 | $94,957,956 | 94957956 | $-20,470,348 | -20470348 |
| 2011 | $41,901,308 | 41901308 | $97,426,414 | 97426414 | $-55,525,106 | -55525106 |
| 2012 | $63,626,675 | 63626675 | $100,689,500 | 100689500 | $-37,062,825 | -37062825 |
| 2013 | $61,928,975 | 61928975 | $106,658,387 | 106658387 | $-44,729,412 | -44729412 |
| 2014 | $76,872,383 | 76872383 | $115,428,670 | 115428670 | $-38,556,287 | -38556287 |
| 2015 | $77,294,234 | 77294234 | $125,458,486 | 125458486 | $-48,164,252 | -48164252 |
| 2016 | $66,681,991 | 66681991 | $130,290,910 | 130290910 | $-63,608,919 | -63608919 |
| 2017 | $70,612,800 | 70612800 | $136,573,000 | 136573000 | $-65,960,200 | -65960200 |
| 2018 | $76,007,496 | 76007496 | $135,681,867 | 135681867 | $-59,674,371 | -59674371 |
| 2019 | $60,084,133 | 60084133 | $134,776,225 | 134776225 | $-74,692,092 | -74692092 |
| 2020 | $69,303,833 | 69303833 | $138,321,485 | 138321485 | $-69,017,652 | -69017652 |
| 2021 | $63,714,834 | 63714834 | $129,635,938 | 129635938 | $-65,921,104 | -65921104 |
| 2022 | $85,728,178 | 85728178 | $147,002,411 | 147002411 | $-61,274,233 | -61274233 |
| 2023 | $73,184,811 | 73184811 | $158,155,877 | 158155877 | $-84,971,066 | -84971066 |
| 2024 | $56,128,512 | 56128512 | $133,074,721 | 133074721 | $-76,946,209 | -76946209 |
| 2025 | $51,971,212 | 51971212 | $94,180,059 | 94180059 | $-42,208,847 | -42208847 |
| 2026 | $26,954,545 | 26954545 | $74,818,461 | 74818461 | $-47,863,916 | -47863916 |
| 2027 | $23,204,545 | 23204545 | $56,972,319 | 56972319 | $-33,767,774 | -33767774 |
| 2028 | $25,454,546 | 25454546 | $45,437,759 | 45437759 | $-19,983,213 | -19983213 |
| 2029 | $25,454,546 | 25454546 | $37,269,628 | 37269628 | $-11,815,082 | -11815082 |
| 2030 | $25,454,546 | 25454546 | $39,665,769 | 39665769 | $-14,211,223 | -14211223 |
| 2031 | $25,454,546 | 25454546 | $38,360,152 | 38360152 | $-12,905,606 | -12905606 |
| 2032 | $25,454,546 | 25454546 | $47,925,459 | 47925459 | $-22,470,913 | -22470913 |
| 2033 | $2,000,000 | 2000000 | $43,068,924 | 43068924 | $-41,068,924 | -41068924 |
|

 See something wrong? Please click
here
here to send us a correction (feedback form opens in a new browser tab).
 2012 Tampa Bay Rays


