| Player | Player Sort | Pos | Salary | Salary Sort | Pct | Pct Sort | WARP | WARP Sort | WARP/$M | WARP/$M Sort | $/WARP | $/WARP Sort | Current Status |
|---|
 Barry Zito
 |
Zito Barry |
RP |
$19,000,000 |
19000000 |
14.40% |
14.40 |
1.40 |
1.40076 |
0.07 |
0.073724210526316 |
$13,564,065 |
13564065.221737 |
|
 Tim Lincecum
 |
Lincecum Tim |
RP |
$18,250,000 |
18250000 |
13.83% |
13.83 |
4.25 |
4.25076 |
0.23 |
0.23291835616438 |
$4,293,350 |
4293349.8950776 |
|
 Matt Cain
 |
Cain Matt |
RP |
$15,833,333 |
15833333 |
12.00% |
12.00 |
6.02 |
6.02012 |
0.38 |
0.38021811326775 |
$2,630,069 |
2630069.3341661 |
|
 Aaron Rowand
 |
Rowand Aaron |
DNP |
$13,600,000 |
13600000 |
10.30% |
10.30 |
— |
0.00 |
— |
0 |
— |
0 |
|
 Aubrey Huff
 |
Huff Aubrey |
PH |
$10,000,000 |
10000000 |
7.58% |
7.58 |
0.10 |
0.0981374 |
0.01 |
0.00981374 |
$101,897,951 |
101897951.23979 |
|
 Brian Wilson
 |
Wilson Brian |
RP |
$8,500,000 |
8500000 |
6.44% |
6.44 |
-0.08 |
-0.0750588 |
— |
0 |
— |
0 |
|
 Melky Cabrera
 |
Cabrera Melky |
LF |
$6,000,000 |
6000000 |
4.55% |
4.55 |
5.34 |
5.34272 |
0.89 |
0.89045333333333 |
$1,123,023 |
1123023.4786775 |
|
 Freddy Sanchez
 |
Sanchez Freddy |
DNP |
$6,000,000 |
6000000 |
4.55% |
4.55 |
— |
0.00 |
— |
0 |
— |
0 |
|
 Jeremy Affeldt
 |
Affeldt Jeremy |
RP |
$5,000,000 |
5000000 |
3.79% |
3.79 |
1.13 |
1.1316 |
0.23 |
0.22632 |
$4,418,522 |
4418522.446094 |
|
 Ángel Pagán
 |
Pagan Angel |
CF |
$4,850,000 |
4850000 |
3.67% |
3.67 |
4.65 |
4.65367 |
0.96 |
0.95951958762887 |
$1,042,188 |
1042188.2084462 |
|
 Javier López
 |
Lopez Javier |
RP |
$4,250,000 |
4250000 |
3.22% |
3.22 |
0.08 |
0.0793092 |
0.02 |
0.018660988235294 |
$53,587,730 |
53587730.048973 |
|
 Pablo Sandoval
 |
Sandoval Pablo |
3B |
$3,200,000 |
3200000 |
2.42% |
2.42 |
3.49 |
3.49373 |
1.09 |
1.091790625 |
$915,927 |
915926.53124311 |
|
 Ryan Vogelsong
 |
Vogelsong Ryan |
RP |
$3,000,000 |
3000000 |
2.27% |
2.27 |
2.33 |
2.33072 |
0.78 |
0.77690666666667 |
$1,287,156 |
1287155.9003226 |
|
 Santiago Casilla
 |
Casilla Santiago |
RP |
$2,200,000 |
2200000 |
1.67% |
1.67 |
0.30 |
0.298846 |
0.14 |
0.13583909090909 |
$7,361,651 |
7361651.1514292 |
|
 Sergio Romo
 |
Romo Sergio |
RP |
$1,575,000 |
1575000 |
1.19% |
1.19 |
1.66 |
1.66429 |
1.06 |
1.0566920634921 |
$946,349 |
946349.49437898 |
|
 Nate Schierholtz
 |
Schierholtz Nate |
RF |
$1,300,000 |
1300000 |
0.98% |
0.98 |
0.28 |
0.283491 |
0.22 |
0.21807 |
$4,585,683 |
4585683.4961251 |
|
 Ryan Theriot
 |
Theriot Ryan |
2B |
$1,250,000 |
1250000 |
0.95% |
0.95 |
-0.60 |
-0.602468 |
— |
0 |
— |
0 |
|
 Guillermo Mota
 |
Mota Guillermo |
RP |
$1,000,000 |
1000000 |
0.76% |
0.76 |
0.36 |
0.363736 |
0.36 |
0.363736 |
$2,749,247 |
2749246.7064024 |
|
 Clay Hensley
 |
Hensley Clay |
RP |
$750,000 |
750000 |
0.57% |
0.57 |
-0.22 |
-0.217054 |
— |
0 |
— |
0 |
|
 Emmanuel Burriss
 |
Burriss Emmanuel |
2B |
$625,000 |
625000 |
0.47% |
0.47 |
-0.78 |
-0.778103 |
— |
0 |
— |
0 |
|
 Buster Posey
 |
Posey Buster |
C |
$615,000 |
615000 |
0.47% |
0.47 |
9.92 |
9.91655 |
16.12 |
16.124471544715 |
$62,018 |
62017.536340764 |
|
 Madison Bumgarner
 |
Bumgarner Madison |
RP |
$560,000 |
560000 |
0.42% |
0.42 |
5.69 |
5.6862 |
10.15 |
10.153928571429 |
$98,484 |
98484.049101333 |
|
 Grégor Blanco
 |
Blanco Gregor |
RF |
$516,000 |
516000 |
0.39% |
0.39 |
1.11 |
1.10523 |
2.14 |
2.1419186046512 |
$466,871 |
466871.14899161 |
|
 Dan Runzler
 |
Runzler Dan |
RP |
$483,000 |
483000 |
0.37% |
0.37 |
0.07 |
0.0697027 |
0.14 |
0.14431200828157 |
$6,929,430 |
6929430.2803191 |
|
 George Kontos
 |
Kontos George |
RP |
$481,350 |
481350 |
0.36% |
0.36 |
1.26 |
1.25667 |
2.61 |
2.6107198504207 |
$383,036 |
383036.11926759 |
|
 Brandon Belt
 |
Belt Brandon |
1B |
$481,000 |
481000 |
0.36% |
0.36 |
2.59 |
2.59327 |
5.39 |
5.3914137214137 |
$185,480 |
185480.10812603 |
|
 Brandon Crawford
 |
Crawford Brandon |
SS |
$481,000 |
481000 |
0.36% |
0.36 |
2.90 |
2.89979 |
6.03 |
6.0286694386694 |
$165,874 |
165874.08053687 |
|
 Héctor Sánchez
 |
Sanchez Hector |
C |
$480,000 |
480000 |
0.36% |
0.36 |
-0.55 |
-0.545073 |
— |
0 |
— |
0 |
|
 Dan Otero
 |
Otero Dan |
RP |
$480,000 |
480000 |
0.36% |
0.36 |
0.01 |
0.00527231 |
0.01 |
0.010983979166667 |
$91,041,688 |
91041687.609416 |
|
 Brett Pill
 |
Pill Brett |
1B |
$480,000 |
480000 |
0.36% |
0.36 |
-0.09 |
-0.0908919 |
— |
0 |
— |
0 |
|
 Eric Surkamp
 |
Surkamp Eric |
DNP |
$480,000 |
480000 |
0.36% |
0.36 |
— |
0.00 |
— |
0 |
— |
0 |
|
 Mike Fontenot
 |
Fontenot Mike |
DNP |
$259,615 |
259615 |
0.20% |
0.20 |
— |
0.00 |
— |
0 |
— |
0 |
|
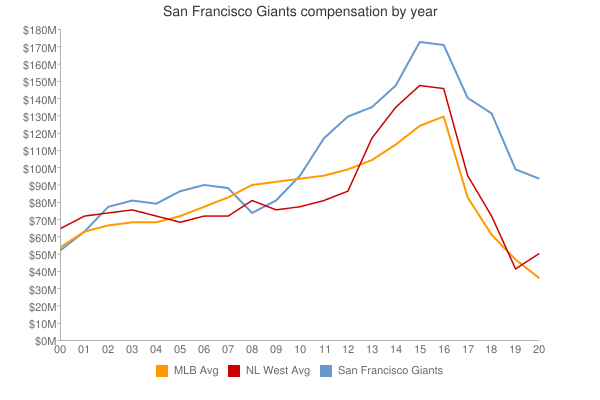
| Year | Giants payroll |
PR Sort |
Avg payroll |
AvgPR Sort |
Diff |
Diff Sort |
|---|
| 2000 | $53,342,826 | 53342826 | $57,491,092 | 57491092 | $-4,148,266 | -4148266 |
| 2001 | $63,289,167 | 63289167 | $67,120,750 | 67120750 | $-3,831,583 | -3831583 |
| 2002 | $78,514,835 | 78514835 | $69,204,705 | 69204705 | $9,310,130 | 9310130 |
| 2003 | $81,302,167 | 81302167 | $72,156,639 | 72156639 | $9,145,528 | 9145528 |
| 2004 | $80,400,833 | 80400833 | $71,426,357 | 71426357 | $8,974,476 | 8974476 |
| 2005 | $88,848,833 | 88848833 | $73,628,169 | 73628169 | $15,220,664 | 15220664 |
| 2006 | $90,017,671 | 90017671 | $81,192,832 | 81192832 | $8,824,839 | 8824839 |
| 2007 | $89,691,052 | 89691052 | $85,747,487 | 85747487 | $3,943,565 | 3943565 |
| 2008 | $75,877,000 | 75877000 | $93,079,041 | 93079041 | $-17,202,041 | -17202041 |
| 2009 | $82,566,450 | 82566450 | $92,957,049 | 92957049 | $-10,390,599 | -10390599 |
| 2010 | $97,023,833 | 97023833 | $94,957,956 | 94957956 | $2,065,877 | 2065877 |
| 2011 | $118,198,333 | 118198333 | $97,426,414 | 97426414 | $20,771,919 | 20771919 |
| 2012 | $131,980,298 | 131980298 | $100,689,500 | 100689500 | $31,290,798 | 31290798 |
| 2013 | $136,908,777 | 136908777 | $106,658,387 | 106658387 | $30,250,390 | 30250390 |
| 2014 | $149,439,474 | 149439474 | $115,428,670 | 115428670 | $34,010,804 | 34010804 |
| 2015 | $173,179,277 | 173179277 | $125,458,486 | 125458486 | $47,720,791 | 47720791 |
| 2016 | $172,086,611 | 172086611 | $130,290,910 | 130290910 | $41,795,701 | 41795701 |
| 2017 | $180,822,611 | 180822611 | $136,573,000 | 136573000 | $44,249,611 | 44249611 |
| 2018 | $200,505,278 | 200505278 | $135,681,867 | 135681867 | $64,823,411 | 64823411 |
| 2019 | $170,179,653 | 170179653 | $134,776,225 | 134776225 | $35,403,428 | 35403428 |
| 2020 | $155,190,747 | 155190747 | $138,321,485 | 138321485 | $16,869,262 | 16869262 |
| 2021 | $149,344,778 | 149344778 | $129,635,938 | 129635938 | $19,708,840 | 19708840 |
| 2022 | $166,189,000 | 166189000 | $147,002,411 | 147002411 | $19,186,589 | 19186589 |
| 2023 | $189,262,500 | 189262500 | $158,155,877 | 158155877 | $31,106,623 | 31106623 |
| 2024 | $189,387,903 | 189387903 | $133,074,721 | 133074721 | $56,313,182 | 56313182 |
| 2025 | $135,000,000 | 135000000 | $94,180,059 | 94180059 | $40,819,941 | 40819941 |
| 2026 | $93,750,000 | 93750000 | $74,818,461 | 74818461 | $18,931,539 | 18931539 |
| 2027 | $35,500,000 | 35500000 | $56,972,319 | 56972319 | $-21,472,319 | -21472319 |
| 2028 | $24,000,000 | 24000000 | $45,437,759 | 45437759 | $-21,437,759 | -21437759 |
|

 See something wrong? Please click
here
here to send us a correction (feedback form opens in a new browser tab).
 2012 San Francisco Giants


