| Player | Player Sort | Pos | Salary | Salary Sort | Pct | Pct Sort | WARP | WARP Sort | WARP/$M | WARP/$M Sort | $/WARP | $/WARP Sort | Current Status |
|---|
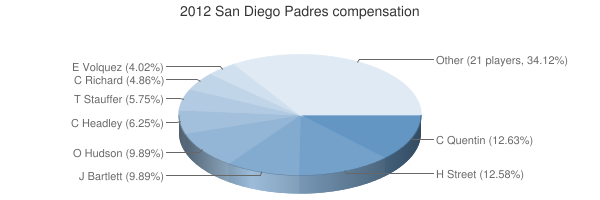
 Carlos Quentin
 |
Quentin Carlos |
LF |
$7,025,000 |
7025000 |
12.63% |
12.63 |
1.91 |
1.91323 |
0.27 |
0.27234590747331 |
$3,671,801 |
3671801.0903028 |
|
 Huston Street
 |
Street Huston |
RP |
$7,000,000 |
7000000 |
12.58% |
12.58 |
1.10 |
1.10376 |
0.16 |
0.15768 |
$6,341,958 |
6341958.3967529 |
|
 Orlando Hudson
 |
Hudson Orlando |
2B |
$5,500,000 |
5500000 |
9.89% |
9.89 |
-0.20 |
-0.203257 |
— |
0 |
— |
0 |
|
 Jason Bartlett
 |
Bartlett Jason |
SS |
$5,500,000 |
5500000 |
9.89% |
9.89 |
-0.50 |
-0.503586 |
— |
0 |
— |
0 |
|
 Chase Headley
 |
Headley Chase |
3B |
$3,475,000 |
3475000 |
6.25% |
6.25 |
5.77 |
5.7723 |
1.66 |
1.6610935251799 |
$602,013 |
602013.06238414 |
|
 Tim Stauffer
 |
Stauffer Tim |
RP |
$3,200,000 |
3200000 |
5.75% |
5.75 |
0.04 |
0.0395624 |
0.01 |
0.01236325 |
$80,884,881 |
80884880.593695 |
|
 Clayton Richard
 |
Richard Clayton |
RP |
$2,705,000 |
2705000 |
4.86% |
4.86 |
1.59 |
1.59111 |
0.59 |
0.58821072088725 |
$1,700,071 |
1700071.0196027 |
|
 Edinson Vólquez
 |
Volquez Edinson |
RP |
$2,237,500 |
2237500 |
4.02% |
4.02 |
0.70 |
0.704045 |
0.31 |
0.31465698324022 |
$3,178,064 |
3178063.9021653 |
|
 Dustin Moseley
 |
Moseley Dustin |
RP |
$2,012,500 |
2012500 |
3.62% |
3.62 |
0.06 |
0.0592208 |
0.03 |
0.02942648447205 |
$33,982,992 |
33982992.462108 |
|
 Nick Hundley
 |
Hundley Nick |
C |
$2,000,000 |
2000000 |
3.60% |
3.60 |
-1.08 |
-1.07593 |
— |
0 |
— |
0 |
|
 Luke Gregerson
 |
Gregerson Luke |
RP |
$1,550,000 |
1550000 |
2.79% |
2.79 |
1.85 |
1.85336 |
1.20 |
1.1957161290323 |
$836,319 |
836318.9018863 |
|
 Will Venable
 |
Venable Will |
RF |
$1,475,000 |
1475000 |
2.65% |
2.65 |
2.02 |
2.02047 |
1.37 |
1.3698101694915 |
$730,028 |
730028.16176434 |
|
 Yonder Alonso
 |
Alonso Yonder |
1B |
$1,400,000 |
1400000 |
2.52% |
2.52 |
1.93 |
1.92649 |
1.38 |
1.3760642857143 |
$726,710 |
726710.2346755 |
|
 Mark Kotsay
 |
Kotsay Mark |
PH |
$1,250,000 |
1250000 |
2.25% |
2.25 |
0.49 |
0.487802 |
0.39 |
0.3902416 |
$2,562,515 |
2562515.1188392 |
|
 Chris Denorfia
 |
Denorfia Chris |
RF |
$1,165,000 |
1165000 |
2.09% |
2.09 |
1.53 |
1.52798 |
1.31 |
1.3115708154506 |
$762,445 |
762444.53461433 |
|
 Jeremy Hermida
 |
Hermida Jeremy |
PH |
$800,000 |
800000 |
1.44% |
1.44 |
0.01 |
0.014912 |
0.02 |
0.01864 |
$53,648,069 |
53648068.669528 |
|
 Yasmani Grandal
 |
Grandal Yasmani |
C |
$750,000 |
750000 |
1.35% |
1.35 |
3.65 |
3.64661 |
4.86 |
4.8621466666667 |
$205,670 |
205670.47202744 |
|
 John Baker
 |
Baker John |
C |
$750,000 |
750000 |
1.35% |
1.35 |
-0.14 |
-0.14477 |
— |
0 |
— |
0 |
|
 Joe Thatcher
 |
Thatcher Joe |
RP |
$700,000 |
700000 |
1.26% |
1.26 |
0.85 |
0.845652 |
1.21 |
1.2080742857143 |
$827,764 |
827763.66637813 |
|
 Cory Luebke
 |
Luebke Cory |
RP |
$625,000 |
625000 |
1.12% |
1.12 |
0.52 |
0.522337 |
0.84 |
0.8357392 |
$1,196,546 |
1196545.5252069 |
|
 Cameron Maybin
 |
Maybin Cameron |
CF |
$600,000 |
600000 |
1.08% |
1.08 |
1.34 |
1.34127 |
2.24 |
2.23545 |
$447,337 |
447337.22516719 |
|
 Micah Owings
 |
Owings Micah |
RP |
$500,000 |
500000 |
0.90% |
0.90 |
0.02 |
0.0152144 |
0.03 |
0.0304288 |
$32,863,603 |
32863602.902513 |
|
 Kyle Blanks
 |
Blanks Kyle |
PH |
$492,400 |
492400 |
0.89% |
0.89 |
-0.04 |
-0.0422007 |
— |
0 |
— |
0 |
|
 Ernesto Frieri
 |
Frieri Ernesto |
RP |
$489,100 |
489100 |
0.88% |
0.88 |
0.33 |
0.328312 |
0.67 |
0.67125741157228 |
$1,489,741 |
1489741.4654353 |
|
 Jesus Guzman
 |
Guzman Jesus |
LF |
$486,600 |
486600 |
0.87% |
0.87 |
1.55 |
1.54584 |
3.18 |
3.1768187422935 |
$314,780 |
314780.3136159 |
|
 Andrew Cashner
 |
Cashner Andrew |
RP |
$486,100 |
486100 |
0.87% |
0.87 |
1.38 |
1.3811 |
2.84 |
2.8411849413701 |
$351,966 |
351965.82434292 |
|
 Anthony Bass
 |
Bass Anthony |
RP |
$485,300 |
485300 |
0.87% |
0.87 |
1.24 |
1.23699 |
2.55 |
2.548918194931 |
$392,323 |
392323.30091593 |
|
 Logan Forsythe
 |
Forsythe Logan |
2B |
$481,400 |
481400 |
0.87% |
0.87 |
0.98 |
0.976502 |
2.03 |
2.0284628167844 |
$492,984 |
492984.14135353 |
|
 Andy Parrino
 |
Parrino Andy |
SS |
$481,000 |
481000 |
0.86% |
0.86 |
0.14 |
0.141868 |
0.29 |
0.29494386694387 |
$3,390,476 |
3390475.6534243 |
|
| Year | Padres payroll |
PR Sort |
Avg payroll |
AvgPR Sort |
Diff |
Diff Sort |
|---|
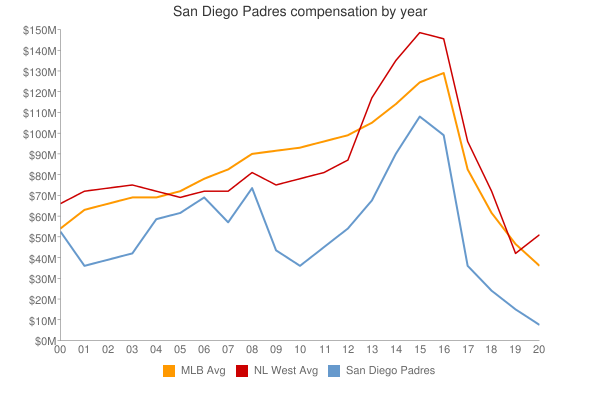
| 1996 | $2,000,000 | 2000000 | $4,583,416 | 4583416 | $-2,583,416 | -2583416 |
| 1997 | $2,000,000 | 2000000 | $4,892,222 | 4892222 | $-2,892,222 | -2892222 |
| 2000 | $53,816,000 | 53816000 | $57,491,092 | 57491092 | $-3,675,092 | -3675092 |
| 2001 | $37,438,000 | 37438000 | $67,120,750 | 67120750 | $-29,682,750 | -29682750 |
| 2002 | $40,678,000 | 40678000 | $69,204,705 | 69204705 | $-28,526,705 | -28526705 |
| 2003 | $43,565,000 | 43565000 | $72,156,639 | 72156639 | $-28,591,639 | -28591639 |
| 2004 | $59,172,333 | 59172333 | $71,426,357 | 71426357 | $-12,254,024 | -12254024 |
| 2005 | $62,186,333 | 62186333 | $73,628,169 | 73628169 | $-11,441,836 | -11441836 |
| 2006 | $69,170,167 | 69170167 | $81,192,832 | 81192832 | $-12,022,665 | -12022665 |
| 2007 | $58,571,067 | 58571067 | $85,747,487 | 85747487 | $-27,176,420 | -27176420 |
| 2008 | $74,010,117 | 74010117 | $93,079,041 | 93079041 | $-19,068,924 | -19068924 |
| 2009 | $44,173,200 | 44173200 | $92,957,049 | 92957049 | $-48,783,849 | -48783849 |
| 2010 | $37,799,300 | 37799300 | $94,957,956 | 94957956 | $-57,158,656 | -57158656 |
| 2011 | $45,869,140 | 45869140 | $97,426,414 | 97426414 | $-51,557,274 | -51557274 |
| 2012 | $55,621,900 | 55621900 | $100,689,500 | 100689500 | $-45,067,600 | -45067600 |
| 2013 | $68,333,600 | 68333600 | $106,658,387 | 106658387 | $-38,324,787 | -38324787 |
| 2014 | $90,636,600 | 90636600 | $115,428,670 | 115428670 | $-24,792,070 | -24792070 |
| 2015 | $108,387,033 | 108387033 | $125,458,486 | 125458486 | $-17,071,453 | -17071453 |
| 2016 | $100,509,500 | 100509500 | $130,290,910 | 130290910 | $-29,781,410 | -29781410 |
| 2017 | $67,624,400 | 67624400 | $136,573,000 | 136573000 | $-68,948,600 | -68948600 |
| 2018 | $94,037,733 | 94037733 | $135,681,867 | 135681867 | $-41,644,134 | -41644134 |
| 2019 | $100,804,100 | 100804100 | $134,776,225 | 134776225 | $-33,972,125 | -33972125 |
| 2020 | $151,461,550 | 151461550 | $138,321,485 | 138321485 | $13,140,065 | 13140065 |
| 2021 | $171,488,220 | 171488220 | $129,635,938 | 129635938 | $41,852,282 | 41852282 |
| 2022 | $212,846,719 | 212846719 | $147,002,411 | 147002411 | $65,844,308 | 65844308 |
| 2023 | $221,599,740 | 221599740 | $158,155,877 | 158155877 | $63,443,863 | 63443863 |
| 2024 | $153,892,054 | 153892054 | $133,074,721 | 133074721 | $20,817,333 | 20817333 |
| 2025 | $150,295,454 | 150295454 | $94,180,059 | 94180059 | $56,115,395 | 56115395 |
| 2026 | $137,745,454 | 137745454 | $74,818,461 | 74818461 | $62,926,993 | 62926993 |
| 2027 | $156,495,454 | 156495454 | $56,972,319 | 56972319 | $99,523,135 | 99523135 |
| 2028 | $124,545,454 | 124545454 | $45,437,759 | 45437759 | $79,107,695 | 79107695 |
| 2029 | $113,545,454 | 113545454 | $37,269,628 | 37269628 | $76,275,826 | 76275826 |
| 2030 | $113,545,454 | 113545454 | $39,665,769 | 39665769 | $73,879,685 | 73879685 |
| 2031 | $101,259,739 | 101259739 | $38,360,152 | 38360152 | $62,899,587 | 62899587 |
| 2032 | $101,259,739 | 101259739 | $47,925,459 | 47925459 | $53,334,280 | 53334280 |
| 2033 | $101,259,739 | 101259739 | $43,068,924 | 43068924 | $58,190,815 | 58190815 |
| 2034 | $36,714,285 | 36714285 | $29,428,571 | 29428571 | $7,285,714 | 7285714 |
|

 See something wrong? Please click
here
here to send us a correction (feedback form opens in a new browser tab).
 2012 San Diego Padres


