| Player | Player Sort | Pos | Salary | Salary Sort | Pct | Pct Sort | WARP | WARP Sort | WARP/$M | WARP/$M Sort | $/WARP | $/WARP Sort | Current Status |
|---|
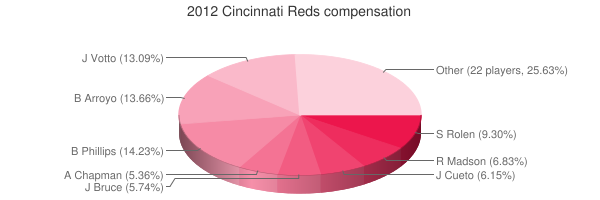
 Brandon Phillips
 |
Phillips Brandon |
2B |
$12,500,000 |
12500000 |
14.23% |
14.23 |
1.24 |
1.23847 |
0.10 |
0.0990776 |
$10,093,099 |
10093098.742804 |
|
 Bronson Arroyo
 |
Arroyo Bronson |
RP |
$12,000,000 |
12000000 |
13.66% |
13.66 |
1.64 |
1.63914 |
0.14 |
0.136595 |
$7,320,912 |
7320912.1856583 |
|
 Joey Votto
 |
Votto Joey |
1B |
$11,500,000 |
11500000 |
13.09% |
13.09 |
6.11 |
6.10901 |
0.53 |
0.53121826086957 |
$1,882,465 |
1882465.407652 |
|
 Scott Rolen
 |
Rolen Scott |
3B |
$8,166,667 |
8166667 |
9.30% |
9.30 |
0.68 |
0.682521 |
0.08 |
0.083573996588816 |
$11,965,444 |
11965444.286696 |
|
 Ryan Madson
 |
Madson Ryan |
DNP |
$6,000,000 |
6000000 |
6.83% |
6.83 |
— |
0.00 |
— |
0 |
— |
0 |
|
 Johnny Cueto
 |
Cueto Johnny |
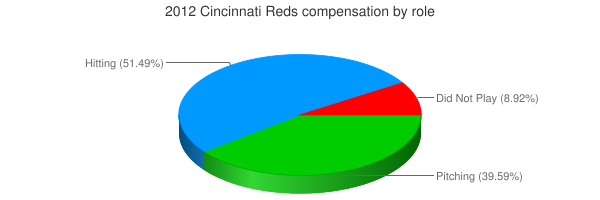
RP |
$5,400,000 |
5400000 |
6.15% |
6.15 |
4.66 |
4.65621 |
0.86 |
0.86226111111111 |
$1,159,742 |
1159741.5065042 |
|
 Jay Bruce
 |
Bruce Jay |
RF |
$5,041,667 |
5041667 |
5.74% |
5.74 |
3.87 |
3.87126 |
0.77 |
0.76785317237334 |
$1,302,332 |
1302332.3155768 |
|
 Aroldis Chapman
 |
Chapman Aroldis |
RP |
$4,708,333 |
4708333 |
5.36% |
5.36 |
2.31 |
2.30598 |
0.49 |
0.48976569839049 |
$2,041,793 |
2041792.6434748 |
|
 Sean Marshall
 |
Marshall Sean |
RP |
$3,100,000 |
3100000 |
3.53% |
3.53 |
1.52 |
1.52441 |
0.49 |
0.49174516129032 |
$2,033,574 |
2033573.6448856 |
|
 Homer Bailey
 |
Bailey Homer |
RP |
$2,425,000 |
2425000 |
2.76% |
2.76 |
2.25 |
2.24594 |
0.93 |
0.92616082474227 |
$1,079,726 |
1079726.0835107 |
|
 Nick Masset
 |
Masset Nick |
RP |
$2,400,000 |
2400000 |
2.73% |
2.73 |
0.13 |
0.125444 |
0.05 |
0.052268333333333 |
$19,132,043 |
19132042.983323 |
|
 Ryan Ludwick
 |
Ludwick Ryan |
LF |
$2,000,000 |
2000000 |
2.28% |
2.28 |
2.30 |
2.30258 |
1.15 |
1.15129 |
$868,591 |
868590.88500725 |
|
 Bill Bray
 |
Bray Bill |
RP |
$1,417,500 |
1417500 |
1.61% |
1.61 |
-0.33 |
-0.334396 |
— |
0 |
— |
0 |
|
 Ryan Hanigan
 |
Hanigan Ryan |
C |
$1,300,000 |
1300000 |
1.48% |
1.48 |
4.56 |
4.56023 |
3.51 |
3.5078692307692 |
$285,073 |
285073.34059905 |
|
 Miguel Cairo
 |
Cairo Miguel |
1B |
$1,000,000 |
1000000 |
1.14% |
1.14 |
-0.52 |
-0.519233 |
— |
0 |
— |
0 |
|
 Wilson Valdez
 |
Valdez Wilson |
SS |
$930,000 |
930000 |
1.06% |
1.06 |
-1.53 |
-1.52953 |
— |
0 |
— |
0 |
|
 Paul Janish
 |
Janish Paul |
DNP |
$850,000 |
850000 |
0.97% |
0.97 |
— |
0.00 |
— |
0 |
— |
0 |
|
 Jose Arredondo
 |
Arredondo Jose |
RP |
$800,000 |
800000 |
0.91% |
0.91 |
0.26 |
0.258952 |
0.32 |
0.32369 |
$3,089,376 |
3089375.6371837 |
|
 Willie Harris
 |
Harris Willie |
PH |
$800,000 |
800000 |
0.91% |
0.91 |
-0.42 |
-0.419205 |
— |
0 |
— |
0 |
|
 Mat Latos
 |
Latos Mat |
RP |
$550,000 |
550000 |
0.63% |
0.63 |
2.99 |
2.99132 |
5.44 |
5.4387636363636 |
$183,865 |
183865.31698381 |
|
 Drew Stubbs
 |
Stubbs Drew |
CF |
$527,500 |
527500 |
0.60% |
0.60 |
-0.84 |
-0.837998 |
— |
0 |
— |
0 |
|
 Mike Leake
 |
Leake Mike |
RP |
$507,500 |
507500 |
0.58% |
0.58 |
3.11 |
3.11302 |
6.13 |
6.1340295566502 |
$163,025 |
163024.97253471 |
|
 Andrew Brackman
 |
Brackman Andrew |
DNP |
$500,000 |
500000 |
0.57% |
0.57 |
— |
0.00 |
— |
0 |
— |
0 |
|
 Chris Heisey
 |
Heisey Chris |
LF |
$495,000 |
495000 |
0.56% |
0.56 |
0.65 |
0.645459 |
1.30 |
1.3039575757576 |
$766,896 |
766896.11578737 |
|
 Logan Ondrusek
 |
Ondrusek Logan |
RP |
$492,500 |
492500 |
0.56% |
0.56 |
-1.00 |
-0.996882 |
— |
0 |
— |
0 |
|
 Sam LeCure
 |
LeCure Sam |
RP |
$487,500 |
487500 |
0.56% |
0.56 |
1.31 |
1.30969 |
2.69 |
2.6865435897436 |
$372,225 |
372225.48847437 |
|
 Alfredo Simon
 |
Simon Alfredo |
RP |
$487,000 |
487000 |
0.55% |
0.55 |
0.40 |
0.399833 |
0.82 |
0.82101232032854 |
$1,218,009 |
1218008.5185565 |
|
 Devin Mesoraco
 |
Mesoraco Devin |
C |
$480,000 |
480000 |
0.55% |
0.55 |
0.78 |
0.779153 |
1.62 |
1.6232354166667 |
$616,054 |
616053.58639446 |
|
 Zack Cozart
 |
Cozart Zack |
SS |
$480,000 |
480000 |
0.55% |
0.55 |
2.33 |
2.33369 |
4.86 |
4.8618541666667 |
$205,683 |
205682.84562217 |
|
 Jordan Smith
 |
Smith Jordan |
DNP |
$480,000 |
480000 |
0.55% |
0.55 |
— |
0.00 |
— |
0 |
— |
0 |
|
| Year | Reds payroll |
PR Sort |
Avg payroll |
AvgPR Sort |
Diff |
Diff Sort |
|---|
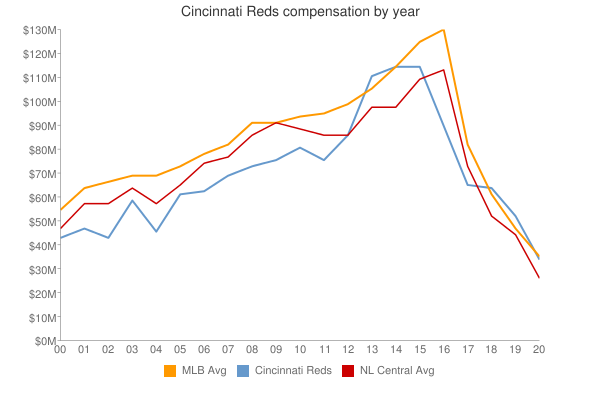
| 2000 | $44,767,200 | 44767200 | $57,491,092 | 57491092 | $-12,723,892 | -12723892 |
| 2001 | $47,974,000 | 47974000 | $67,120,750 | 67120750 | $-19,146,750 | -19146750 |
| 2002 | $43,203,890 | 43203890 | $69,204,705 | 69204705 | $-26,000,815 | -26000815 |
| 2003 | $58,541,000 | 58541000 | $72,156,639 | 72156639 | $-13,615,639 | -13615639 |
| 2004 | $46,697,250 | 46697250 | $71,426,357 | 71426357 | $-24,729,107 | -24729107 |
| 2005 | $62,594,583 | 62594583 | $73,628,169 | 73628169 | $-11,033,586 | -11033586 |
| 2006 | $63,631,833 | 63631833 | $81,192,832 | 81192832 | $-17,560,999 | -17560999 |
| 2007 | $69,910,833 | 69910833 | $85,747,487 | 85747487 | $-15,836,654 | -15836654 |
| 2008 | $72,240,000 | 72240000 | $93,079,041 | 93079041 | $-20,839,041 | -20839041 |
| 2009 | $72,283,500 | 72283500 | $92,957,049 | 92957049 | $-20,673,549 | -20673549 |
| 2010 | $76,876,500 | 76876500 | $94,957,956 | 94957956 | $-18,081,456 | -18081456 |
| 2011 | $76,631,134 | 76631134 | $97,426,414 | 97426414 | $-20,795,280 | -20795280 |
| 2012 | $87,826,167 | 87826167 | $100,689,500 | 100689500 | $-12,863,333 | -12863333 |
| 2013 | $111,105,533 | 111105533 | $106,658,387 | 106658387 | $4,447,146 | 4447146 |
| 2014 | $115,384,724 | 115384724 | $115,428,670 | 115428670 | $-43,946 | -43946 |
| 2015 | $115,373,953 | 115373953 | $125,458,486 | 125458486 | $-10,084,533 | -10084533 |
| 2016 | $90,416,228 | 90416228 | $130,290,910 | 130290910 | $-39,874,682 | -39874682 |
| 2017 | $95,375,786 | 95375786 | $136,573,000 | 136573000 | $-41,197,214 | -41197214 |
| 2018 | $101,337,500 | 101337500 | $135,681,867 | 135681867 | $-34,344,367 | -34344367 |
| 2019 | $127,218,214 | 127218214 | $134,776,225 | 134776225 | $-7,558,011 | -7558011 |
| 2020 | $145,670,792 | 145670792 | $138,321,485 | 138321485 | $7,349,307 | 7349307 |
| 2021 | $129,642,381 | 129642381 | $129,635,938 | 129635938 | $6,443 | 6443 |
| 2022 | $107,955,000 | 107955000 | $147,002,411 | 147002411 | $-39,047,411 | -39047411 |
| 2023 | $94,198,333 | 94198333 | $158,155,877 | 158155877 | $-63,957,544 | -63957544 |
| 2024 | $100,758,333 | 100758333 | $133,074,721 | 133074721 | $-32,316,388 | -32316388 |
| 2025 | $74,483,333 | 74483333 | $94,180,059 | 94180059 | $-19,696,726 | -19696726 |
| 2026 | $45,483,333 | 45483333 | $74,818,461 | 74818461 | $-29,335,128 | -29335128 |
| 2027 | $42,483,333 | 42483333 | $56,972,319 | 56972319 | $-14,488,986 | -14488986 |
| 2028 | $16,333,333 | 16333333 | $45,437,759 | 45437759 | $-29,104,426 | -29104426 |
| 2029 | $2,000,000 | 2000000 | $37,269,628 | 37269628 | $-35,269,628 | -35269628 |
|

 See something wrong? Please click
here
here to send us a correction (feedback form opens in a new browser tab).
 2012 Cincinnati Reds


