| Player | Player Sort | Pos | Salary | Salary Sort | Pct | Pct Sort | WARP | WARP Sort | WARP/$M | WARP/$M Sort | $/WARP | $/WARP Sort | Current Status |
|---|
 Barry Zito
 |
Zito Barry |
RP |
$18,500,000 |
18500000 |
15.65% |
15.65 |
-0.26 |
-0.259348 |
— |
0 |
— |
0 |
|
 Tim Lincecum
 |
Lincecum Tim |
RP |
$14,000,000 |
14000000 |
11.84% |
11.84 |
4.76 |
4.75704 |
0.34 |
0.33978857142857 |
$2,943,007 |
2943006.5755175 |
|
 Aaron Rowand
 |
Rowand Aaron |
CF |
$13,600,000 |
13600000 |
11.51% |
11.51 |
0.51 |
0.512891 |
0.04 |
0.037712573529412 |
$26,516,355 |
26516355.32696 |
|
 Aubrey Huff
 |
Huff Aubrey |
1B |
$10,000,000 |
10000000 |
8.46% |
8.46 |
0.53 |
0.534166 |
0.05 |
0.0534166 |
$18,720,772 |
18720772.194411 |
|
 Matt Cain
 |
Cain Matt |
RP |
$7,333,333 |
7333333 |
6.20% |
6.20 |
5.69 |
5.69434 |
0.78 |
0.77650094438641 |
$1,287,828 |
1287828.4401704 |
|
 Brian Wilson
 |
Wilson Brian |
RP |
$6,500,000 |
6500000 |
5.50% |
5.50 |
0.51 |
0.509785 |
0.08 |
0.078428461538462 |
$12,750,473 |
12750473.238718 |
|
 Miguel Tejada
 |
Tejada Miguel |
3B |
$6,500,000 |
6500000 |
5.50% |
5.50 |
1.09 |
1.08551 |
0.17 |
0.16700153846154 |
$5,987,969 |
5987968.7888642 |
|
 Cody Ross
 |
Ross Cody |
LF |
$6,300,000 |
6300000 |
5.33% |
5.33 |
1.55 |
1.55457 |
0.25 |
0.24675714285714 |
$4,052,568 |
4052567.591038 |
|
 Mark DeRosa
 |
DeRosa Mark |
PH |
$6,000,000 |
6000000 |
5.08% |
5.08 |
0.46 |
0.463717 |
0.08 |
0.077286166666667 |
$12,938,926 |
12938926.112262 |
|
 Freddy Sanchez
 |
Sanchez Freddy |
2B |
$6,000,000 |
6000000 |
5.08% |
5.08 |
0.32 |
0.315486 |
0.05 |
0.052581 |
$19,018,277 |
19018276.563778 |
|
 Jonathan Sánchez
 |
Sanchez Jonathan |
RP |
$4,800,000 |
4800000 |
4.06% |
4.06 |
1.05 |
1.04503 |
0.22 |
0.21771458333333 |
$4,593,170 |
4593169.5740792 |
|
 Jeremy Affeldt
 |
Affeldt Jeremy |
RP |
$4,500,000 |
4500000 |
3.81% |
3.81 |
0.72 |
0.715355 |
0.16 |
0.15896777777778 |
$6,290,583 |
6290582.9972531 |
|
 Javier López
 |
Lopez Javier |
RP |
$2,375,000 |
2375000 |
2.01% |
2.01 |
0.40 |
0.404139 |
0.17 |
0.17016378947368 |
$5,876,691 |
5876690.9404932 |
|
 Andres Torres
 |
Torres Andres |
CF |
$2,200,000 |
2200000 |
1.86% |
1.86 |
1.59 |
1.58932 |
0.72 |
0.72241818181818 |
$1,384,240 |
1384239.8006695 |
|
 Ramon E Ramirez
 |
Ramirez Ramon E |
RP |
$1,650,000 |
1650000 |
1.40% |
1.40 |
1.66 |
1.65763 |
1.00 |
1.0046242424242 |
$995,397 |
995397.04276588 |
|
 Santiago Casilla
 |
Casilla Santiago |
RP |
$1,300,000 |
1300000 |
1.10% |
1.10 |
0.61 |
0.613662 |
0.47 |
0.47204769230769 |
$2,118,430 |
2118430.0152201 |
|
 Mike Fontenot
 |
Fontenot Mike |
SS |
$1,050,000 |
1050000 |
0.89% |
0.89 |
0.78 |
0.783569 |
0.75 |
0.74625619047619 |
$1,340,022 |
1340022.3847549 |
|
 Pat Burrell
 |
Burrell Pat |
LF |
$1,000,000 |
1000000 |
0.85% |
0.85 |
0.62 |
0.624048 |
0.62 |
0.624048 |
$1,602,441 |
1602440.8378843 |
|
 Guillermo Mota
 |
Mota Guillermo |
RP |
$925,000 |
925000 |
0.78% |
0.78 |
1.39 |
1.38934 |
1.50 |
1.5019891891892 |
$665,784 |
665783.75343688 |
|
 Buster Posey
 |
Posey Buster |
C |
$575,000 |
575000 |
0.49% |
0.49 |
1.54 |
1.54303 |
2.68 |
2.6835304347826 |
$372,643 |
372643.43531882 |
|
 Pablo Sandoval
 |
Sandoval Pablo |
3B |
$500,000 |
500000 |
0.42% |
0.42 |
5.82 |
5.82211 |
11.64 |
11.64422 |
$85,880 |
85879.517906738 |
|
 Sergio Romo
 |
Romo Sergio |
RP |
$450,000 |
450000 |
0.38% |
0.38 |
1.49 |
1.49304 |
3.32 |
3.3178666666667 |
$301,398 |
301398.48898891 |
|
 Madison Bumgarner
 |
Bumgarner Madison |
RP |
$450,000 |
450000 |
0.38% |
0.38 |
4.71 |
4.70765 |
10.46 |
10.461444444444 |
$95,589 |
95589.094346436 |
|
 Nate Schierholtz
 |
Schierholtz Nate |
RF |
$432,500 |
432500 |
0.37% |
0.37 |
2.33 |
2.33113 |
5.39 |
5.3898959537572 |
$185,532 |
185532.33839383 |
|
 Eli Whiteside
 |
Whiteside Eli |
C |
$425,000 |
425000 |
0.36% |
0.36 |
1.54 |
1.54059 |
3.62 |
3.6249176470588 |
$275,868 |
275868.33615693 |
|
 Dan Runzler
 |
Runzler Dan |
RP |
$418,500 |
418500 |
0.35% |
0.35 |
0.22 |
0.217561 |
0.52 |
0.51985902031063 |
$1,923,598 |
1923598.4390585 |
|
 Brandon Belt
 |
Belt Brandon |
LF |
$414,000 |
414000 |
0.35% |
0.35 |
0.59 |
0.594177 |
1.44 |
1.4352101449275 |
$696,762 |
696762.07594707 |
|
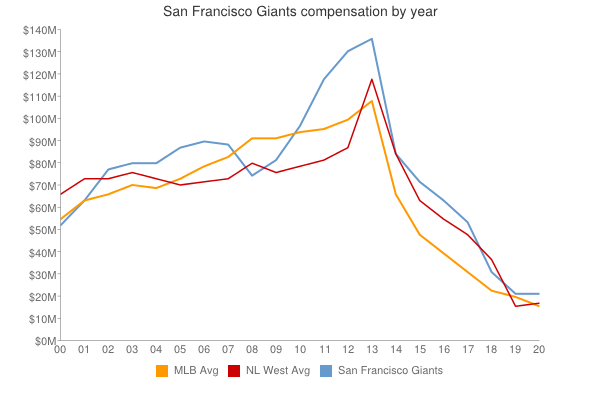
| Year | Giants payroll |
PR Sort |
Avg payroll |
AvgPR Sort |
Diff |
Diff Sort |
|---|
| 2000 | $53,342,826 | 53342826 | $56,164,089 | 56164089 | $-2,821,263 | -2821263 |
| 2001 | $63,289,167 | 63289167 | $65,991,638 | 65991638 | $-2,702,471 | -2702471 |
| 2002 | $78,514,835 | 78514835 | $68,244,471 | 68244471 | $10,270,364 | 10270364 |
| 2003 | $81,302,167 | 81302167 | $71,318,479 | 71318479 | $9,983,688 | 9983688 |
| 2004 | $80,400,833 | 80400833 | $70,466,961 | 70466961 | $9,933,872 | 9933872 |
| 2005 | $88,848,833 | 88848833 | $73,264,780 | 73264780 | $15,584,053 | 15584053 |
| 2006 | $90,017,671 | 90017671 | $79,051,754 | 79051754 | $10,965,917 | 10965917 |
| 2007 | $89,691,052 | 89691052 | $83,931,138 | 83931138 | $5,759,914 | 5759914 |
| 2008 | $75,877,000 | 75877000 | $90,812,373 | 90812373 | $-14,935,373 | -14935373 |
| 2009 | $82,566,450 | 82566450 | $91,093,211 | 91093211 | $-8,526,761 | -8526761 |
| 2010 | $97,023,833 | 97023833 | $93,373,681 | 93373681 | $3,650,152 | 3650152 |
| 2011 | $118,198,333 | 118198333 | $96,102,034 | 96102034 | $22,096,299 | 22096299 |
| 2012 | $131,980,298 | 131980298 | $100,657,138 | 100657138 | $31,323,160 | 31323160 |
| 2013 | $136,908,777 | 136908777 | $109,024,990 | 109024990 | $27,883,787 | 27883787 |
| 2014 | $149,439,474 | 149439474 | $117,828,782 | 117828782 | $31,610,692 | 31610692 |
| 2015 | $173,179,277 | 173179277 | $127,404,244 | 127404244 | $45,775,033 | 45775033 |
| 2016 | $172,086,611 | 172086611 | $132,219,407 | 132219407 | $39,867,204 | 39867204 |
| 2017 | $180,822,611 | 180822611 | $137,302,894 | 137302894 | $43,519,717 | 43519717 |
| 2018 | $200,505,278 | 200505278 | $136,929,168 | 136929168 | $63,576,110 | 63576110 |
| 2019 | $170,179,653 | 170179653 | $136,944,257 | 136944257 | $33,235,396 | 33235396 |
| 2020 | $155,190,747 | 155190747 | $140,677,788 | 140677788 | $14,512,959 | 14512959 |
| 2021 | $149,344,778 | 149344778 | $132,162,631 | 132162631 | $17,182,147 | 17182147 |
| 2022 | $166,189,000 | 166189000 | $149,374,046 | 149374046 | $16,814,954 | 16814954 |
| 2023 | $189,262,500 | 189262500 | $160,460,390 | 160460390 | $28,802,110 | 28802110 |
| 2024 | $189,387,903 | 189387903 | $135,504,022 | 135504022 | $53,883,881 | 53883881 |
| 2025 | $135,000,000 | 135000000 | $96,417,302 | 96417302 | $38,582,698 | 38582698 |
| 2026 | $93,750,000 | 93750000 | $76,694,120 | 76694120 | $17,055,880 | 17055880 |
| 2027 | $35,500,000 | 35500000 | $58,935,617 | 58935617 | $-23,435,617 | -23435617 |
| 2028 | $24,000,000 | 24000000 | $45,437,759 | 45437759 | $-21,437,759 | -21437759 |
|

 See something wrong? Please click
here
here to send us a correction (feedback form opens in a new browser tab).
 2011 San Francisco Giants


