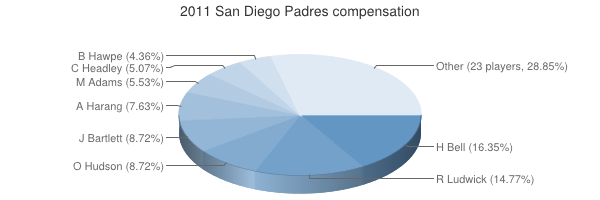
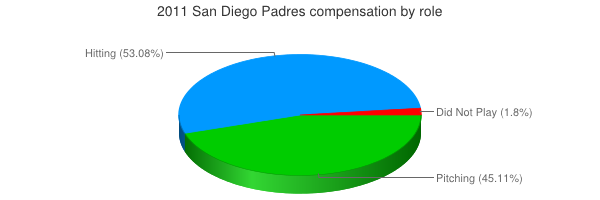
| Player | Player Sort | Pos | Salary | Salary Sort | Pct | Pct Sort | WARP | WARP Sort | WARP/$M | WARP/$M Sort | $/WARP | $/WARP Sort | Current Status |
|---|
 Heath Bell
 |
Bell Heath |
RP |
$7,500,000 |
7500000 |
16.35% |
16.35 |
1.12 |
1.1249 |
0.15 |
0.14998666666667 |
$6,667,259 |
6667259.3119388 |
|
 Ryan Ludwick
 |
Ludwick Ryan |
LF |
$6,775,000 |
6775000 |
14.77% |
14.77 |
0.02 |
0.0235243 |
0.00 |
0.003472221402214 |
$288,000,068 |
288000068.01478 |
|
 Jason Bartlett
 |
Bartlett Jason |
SS |
$4,000,000 |
4000000 |
8.72% |
8.72 |
1.39 |
1.39221 |
0.35 |
0.3480525 |
$2,873,130 |
2873129.772089 |
|
 Orlando Hudson
 |
Hudson Orlando |
2B |
$4,000,000 |
4000000 |
8.72% |
8.72 |
1.31 |
1.30888 |
0.33 |
0.32722 |
$3,056,048 |
3056047.9188314 |
|
 Aaron Harang
 |
Harang Aaron |
RP |
$3,500,000 |
3500000 |
7.63% |
7.63 |
0.99 |
0.993192 |
0.28 |
0.28376914285714 |
$3,523,991 |
3523991.332995 |
|
 Mike Adams
 |
Adams Mike |
RP |
$2,535,000 |
2535000 |
5.53% |
5.53 |
1.36 |
1.35626 |
0.54 |
0.53501380670611 |
$1,869,111 |
1869110.6425022 |
|
 Chase Headley
 |
Headley Chase |
3B |
$2,325,000 |
2325000 |
5.07% |
5.07 |
1.96 |
1.95667 |
0.84 |
0.84157849462366 |
$1,188,243 |
1188243.2908973 |
|
 Brad Hawpe
 |
Hawpe Brad |
1B |
$2,000,000 |
2000000 |
4.36% |
4.36 |
-0.67 |
-0.667949 |
— |
0 |
— |
0 |
|
 Chad Qualls
 |
Qualls Chad |
RP |
$1,500,000 |
1500000 |
3.27% |
3.27 |
0.51 |
0.507961 |
0.34 |
0.33864066666667 |
$2,952,983 |
2952982.6108697 |
|
 Tim Stauffer
 |
Stauffer Tim |
RP |
$1,075,000 |
1075000 |
2.34% |
2.34 |
3.59 |
3.59001 |
3.34 |
3.3395441860465 |
$299,442 |
299442.06283548 |
|
 Dustin Moseley
 |
Moseley Dustin |
RP |
$900,000 |
900000 |
1.96% |
1.96 |
1.89 |
1.89489 |
2.11 |
2.1054333333333 |
$474,962 |
474961.60727008 |
|
 Jorge Cantu
 |
Cantu Jorge |
1B |
$850,000 |
850000 |
1.85% |
1.85 |
-1.14 |
-1.14054 |
— |
0 |
— |
0 |
|
 Chris Denorfia
 |
Denorfia Chris |
RF |
$800,000 |
800000 |
1.74% |
1.74 |
1.06 |
1.05523 |
1.32 |
1.3190375 |
$758,129 |
758128.5596505 |
|
 Pat Neshek
 |
Neshek Pat |
RP |
$625,000 |
625000 |
1.36% |
1.36 |
-0.15 |
-0.153432 |
— |
0 |
— |
0 |
|
 Alberto Gonzalez
 |
Gonzalez Alberto |
2B |
$600,000 |
600000 |
1.31% |
1.31 |
-0.49 |
-0.485966 |
— |
0 |
— |
0 |
|
 Clayton Richard
 |
Richard Clayton |
RP |
$468,800 |
468800 |
1.02% |
1.02 |
0.04 |
0.0408405 |
0.09 |
0.087117107508532 |
$11,478,802 |
11478801.679705 |
|
 Mat Latos
 |
Latos Mat |
RP |
$460,700 |
460700 |
1.00% |
1.00 |
4.91 |
4.91407 |
10.67 |
10.666529194704 |
$93,751 |
93751.208265247 |
|
 Luke Gregerson
 |
Gregerson Luke |
RP |
$447,800 |
447800 |
0.98% |
0.98 |
0.51 |
0.509449 |
1.14 |
1.1376708351943 |
$878,989 |
878988.86836563 |
|
 Will Venable
 |
Venable Will |
RF |
$444,400 |
444400 |
0.97% |
0.97 |
1.90 |
1.90127 |
4.28 |
4.2782853285329 |
$233,739 |
233738.50110715 |
|
 Nick Hundley
 |
Hundley Nick |
C |
$439,900 |
439900 |
0.96% |
0.96 |
1.99 |
1.98941 |
4.52 |
4.5224141850421 |
$221,121 |
221120.83482037 |
|
 Joe Thatcher
 |
Thatcher Joe |
RP |
$433,900 |
433900 |
0.95% |
0.95 |
0.13 |
0.126417 |
0.29 |
0.29135054159945 |
$3,432,292 |
3432291.5430678 |
|
 Cameron Maybin
 |
Maybin Cameron |
CF |
$429,100 |
429100 |
0.94% |
0.94 |
3.32 |
3.31877 |
7.73 |
7.7342577487765 |
$129,295 |
129294.88937166 |
|
 Kyle Blanks
 |
Blanks Kyle |
LF |
$424,700 |
424700 |
0.93% |
0.93 |
0.97 |
0.967374 |
2.28 |
2.2777819637391 |
$439,024 |
439023.58343309 |
|
 Eric Patterson
 |
Patterson Eric |
PH |
$423,300 |
423300 |
0.92% |
0.92 |
-0.18 |
-0.184531 |
— |
0 |
— |
0 |
|
 Rob Johnson
 |
Johnson Rob |
C |
$421,700 |
421700 |
0.92% |
0.92 |
-0.93 |
-0.933399 |
— |
0 |
— |
0 |
|
 Ernesto Frieri
 |
Frieri Ernesto |
RP |
$417,100 |
417100 |
0.91% |
0.91 |
-0.11 |
-0.108321 |
— |
0 |
— |
0 |
|
 Cory Luebke
 |
Luebke Cory |
RP |
$415,600 |
415600 |
0.91% |
0.91 |
4.52 |
4.52324 |
10.88 |
10.883638113571 |
$91,881 |
91881.041023691 |
|
 Jarrett Hoffpauir
 |
Hoffpauir Jarrett |
DNP |
$414,800 |
414800 |
0.90% |
0.90 |
— |
0.00 |
— |
0 |
— |
0 |
|
 Samuel Deduno
 |
Deduno Samuel |
RP |
$414,240 |
414240 |
0.90% |
0.90 |
0.06 |
0.0641503 |
0.15 |
0.15486264001545 |
$6,457,335 |
6457335.3515104 |
|
 Mike Baxter
 |
Baxter Mike |
DNP |
$414,100 |
414100 |
0.90% |
0.90 |
— |
0.00 |
— |
0 |
— |
0 |
|
 Cedric Hunter
 |
Hunter Cedric |
PH |
$414,000 |
414000 |
0.90% |
0.90 |
0.01 |
0.0133324 |
0.03 |
0.0322038647343 |
$31,052,174 |
31052173.652156 |
|
| Year | Padres payroll |
PR Sort |
Avg payroll |
AvgPR Sort |
Diff |
Diff Sort |
|---|
| 1996 | $2,000,000 | 2000000 | $4,583,416 | 4583416 | $-2,583,416 | -2583416 |
| 1997 | $2,000,000 | 2000000 | $4,892,222 | 4892222 | $-2,892,222 | -2892222 |
| 2000 | $53,816,000 | 53816000 | $56,164,089 | 56164089 | $-2,348,089 | -2348089 |
| 2001 | $37,438,000 | 37438000 | $65,991,638 | 65991638 | $-28,553,638 | -28553638 |
| 2002 | $40,678,000 | 40678000 | $68,244,471 | 68244471 | $-27,566,471 | -27566471 |
| 2003 | $43,565,000 | 43565000 | $71,318,479 | 71318479 | $-27,753,479 | -27753479 |
| 2004 | $59,172,333 | 59172333 | $70,466,961 | 70466961 | $-11,294,628 | -11294628 |
| 2005 | $62,186,333 | 62186333 | $73,264,780 | 73264780 | $-11,078,447 | -11078447 |
| 2006 | $69,170,167 | 69170167 | $79,051,754 | 79051754 | $-9,881,587 | -9881587 |
| 2007 | $58,571,067 | 58571067 | $83,931,138 | 83931138 | $-25,360,071 | -25360071 |
| 2008 | $74,010,117 | 74010117 | $90,812,373 | 90812373 | $-16,802,256 | -16802256 |
| 2009 | $44,173,200 | 44173200 | $91,093,211 | 91093211 | $-46,920,011 | -46920011 |
| 2010 | $37,799,300 | 37799300 | $93,373,681 | 93373681 | $-55,574,381 | -55574381 |
| 2011 | $45,869,140 | 45869140 | $96,102,034 | 96102034 | $-50,232,894 | -50232894 |
| 2012 | $55,621,900 | 55621900 | $100,657,138 | 100657138 | $-45,035,238 | -45035238 |
| 2013 | $68,333,600 | 68333600 | $109,024,990 | 109024990 | $-40,691,390 | -40691390 |
| 2014 | $90,636,600 | 90636600 | $117,828,782 | 117828782 | $-27,192,182 | -27192182 |
| 2015 | $108,387,033 | 108387033 | $127,404,244 | 127404244 | $-19,017,211 | -19017211 |
| 2016 | $100,509,500 | 100509500 | $132,219,407 | 132219407 | $-31,709,907 | -31709907 |
| 2017 | $67,624,400 | 67624400 | $137,302,894 | 137302894 | $-69,678,494 | -69678494 |
| 2018 | $94,037,733 | 94037733 | $136,929,168 | 136929168 | $-42,891,435 | -42891435 |
| 2019 | $100,804,100 | 100804100 | $136,944,257 | 136944257 | $-36,140,157 | -36140157 |
| 2020 | $151,461,550 | 151461550 | $140,677,788 | 140677788 | $10,783,762 | 10783762 |
| 2021 | $171,488,220 | 171488220 | $132,162,631 | 132162631 | $39,325,589 | 39325589 |
| 2022 | $212,846,719 | 212846719 | $149,374,046 | 149374046 | $63,472,673 | 63472673 |
| 2023 | $221,599,740 | 221599740 | $160,460,390 | 160460390 | $61,139,350 | 61139350 |
| 2024 | $153,892,054 | 153892054 | $135,504,022 | 135504022 | $18,388,032 | 18388032 |
| 2025 | $150,295,454 | 150295454 | $96,417,302 | 96417302 | $53,878,152 | 53878152 |
| 2026 | $137,745,454 | 137745454 | $76,694,120 | 76694120 | $61,051,334 | 61051334 |
| 2027 | $156,495,454 | 156495454 | $58,935,617 | 58935617 | $97,559,837 | 97559837 |
| 2028 | $124,545,454 | 124545454 | $45,437,759 | 45437759 | $79,107,695 | 79107695 |
| 2029 | $113,545,454 | 113545454 | $37,269,628 | 37269628 | $76,275,826 | 76275826 |
| 2030 | $113,545,454 | 113545454 | $39,665,769 | 39665769 | $73,879,685 | 73879685 |
| 2031 | $101,259,739 | 101259739 | $38,360,152 | 38360152 | $62,899,587 | 62899587 |
| 2032 | $101,259,739 | 101259739 | $47,925,459 | 47925459 | $53,334,280 | 53334280 |
| 2033 | $101,259,739 | 101259739 | $43,068,924 | 43068924 | $58,190,815 | 58190815 |
| 2034 | $36,714,285 | 36714285 | $29,428,571 | 29428571 | $7,285,714 | 7285714 |
|

 See something wrong? Please click
here
here to send us a correction (feedback form opens in a new browser tab).
 2011 San Diego Padres


