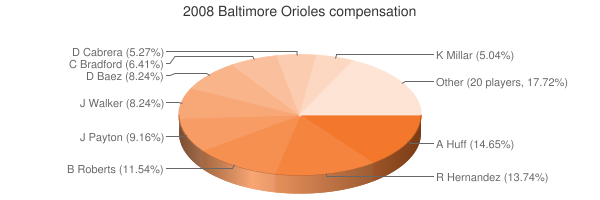
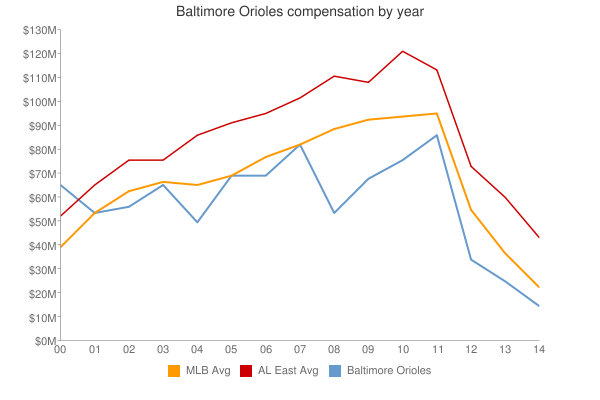
| Player | Player Sort | Pos | Salary | Salary Sort | Pct | Pct Sort | WARP | WARP Sort | WARP/$M | WARP/$M Sort | $/WARP | $/WARP Sort | Current Status |
|---|
 Aubrey Huff
 |
Huff Aubrey |
DH |
$8,000,000 |
8000000 |
12.00% |
12.00 |
3.63 |
3.63009 |
0.45 |
0.45376125 |
$2,203,802 |
2203802.1095896 |
|
 Melvin Mora
 |
Mora Melvin |
3B |
$7,826,914 |
7826914 |
11.74% |
11.74 |
3.61 |
3.6141 |
0.46 |
0.46175286964952 |
$2,165,661 |
2165660.6070668 |
|
 Ramon Hernandez
 |
Hernandez Ramon |
C |
$7,500,000 |
7500000 |
11.25% |
11.25 |
1.59 |
1.5904 |
0.21 |
0.21205333333333 |
$4,715,795 |
4715794.7686117 |
|
 Brian Roberts
 |
Roberts Brian |
2B |
$6,300,000 |
6300000 |
9.45% |
9.45 |
4.61 |
4.60877 |
0.73 |
0.73155079365079 |
$1,366,959 |
1366959.0801884 |
|
 Danys Baez
 |
Baez Danys |
DNP |
$6,166,667 |
6166667 |
9.25% |
9.25 |
— |
0.00 |
— |
0 |
— |
0 |
|
 Jay Payton
 |
Payton Jay |
LF |
$5,000,000 |
5000000 |
7.50% |
7.50 |
0.91 |
0.911254 |
0.18 |
0.1822508 |
$5,486,944 |
5486944.3645789 |
|
 Jamie Walker
 |
Walker Jamie |
RP |
$4,500,000 |
4500000 |
6.75% |
6.75 |
0.54 |
0.535557 |
0.12 |
0.11901266666667 |
$8,402,467 |
8402466.9643007 |
|
 Kevin Millar
 |
Millar Kevin |
1B |
$3,800,000 |
3800000 |
5.70% |
5.70 |
0.26 |
0.25511 |
0.07 |
0.067134210526316 |
$14,895,535 |
14895535.2593 |
|
 Chad Bradford
 |
Bradford Chad |
RP |
$3,500,000 |
3500000 |
5.25% |
5.25 |
0.46 |
0.460243 |
0.13 |
0.131498 |
$7,604,678 |
7604678.3981505 |
|
 Daniel Cabrera
 |
Cabrera Daniel |
RP |
$2,875,000 |
2875000 |
4.31% |
4.31 |
-3.82 |
-3.82483 |
— |
0 |
— |
0 |
|
 Steve Trachsel
 |
Trachsel Steve |
RP |
$1,500,000 |
1500000 |
2.25% |
2.25 |
-1.09 |
-1.08729 |
— |
0 |
— |
0 |
|
 George Sherrill
 |
Sherrill George |
RP |
$980,000 |
980000 |
1.47% |
1.47 |
0.09 |
0.0924519 |
0.09 |
0.094338673469388 |
$10,600,107 |
10600106.650053 |
|
 Adam Loewen
 |
Loewen Adam |
RP |
$816,000 |
816000 |
1.22% |
1.22 |
-0.56 |
-0.56359 |
— |
0 |
— |
0 |
|
 Jeremy Guthrie
 |
Guthrie Jeremy |
RP |
$770,000 |
770000 |
1.16% |
1.16 |
2.11 |
2.10901 |
2.74 |
2.738974025974 |
$365,100 |
365100.2128961 |
|
 Fernando Cabrera
 |
Cabrera Fernando |
RP |
$575,000 |
575000 |
0.86% |
0.86 |
0.03 |
0.0276856 |
0.05 |
0.048148869565217 |
$20,768,920 |
20768919.582743 |
|
 Greg Aquino
 |
Aquino Greg |
RP |
$500,000 |
500000 |
0.75% |
0.75 |
-0.33 |
-0.333555 |
— |
0 |
— |
0 |
|
 Nick Markakis
 |
Markakis Nick |
RF |
$455,000 |
455000 |
0.68% |
0.68 |
5.82 |
5.81765 |
12.79 |
12.786043956044 |
$78,210 |
78210.273907849 |
|
 Lance Cormier
 |
Cormier Lance |
RP |
$450,000 |
450000 |
0.68% |
0.68 |
0.82 |
0.821866 |
1.83 |
1.8263688888889 |
$547,535 |
547534.51292546 |
|
 Luke Scott
 |
Scott Luke |
LF |
$430,000 |
430000 |
0.65% |
0.65 |
1.82 |
1.82422 |
4.24 |
4.2423720930233 |
$235,717 |
235717.18323448 |
|
 Guillermo Quiroz
 |
Quiroz Guillermo |
C |
$400,000 |
400000 |
0.60% |
0.60 |
-0.44 |
-0.435674 |
— |
0 |
— |
0 |
|
 Matt Albers
 |
Albers Matt |
RP |
$395,000 |
395000 |
0.59% |
0.59 |
-0.34 |
-0.33561 |
— |
0 |
— |
0 |
|
 Brian Burres
 |
Burres Brian |
RP |
$395,000 |
395000 |
0.59% |
0.59 |
-2.82 |
-2.82322 |
— |
0 |
— |
0 |
|
 Adam Jones
 |
Jones Adam |
CF |
$390,000 |
390000 |
0.59% |
0.59 |
0.95 |
0.947464 |
2.43 |
2.4293948717949 |
$411,625 |
411625.13826383 |
|
 Jim Hoey
 |
Hoey Jim |
DNP |
$390,000 |
390000 |
0.59% |
0.59 |
— |
0.00 |
— |
0 |
— |
0 |
|
 Luis Hernandez
 |
Hernandez Luis |
SS |
$390,000 |
390000 |
0.59% |
0.59 |
-0.47 |
-0.474306 |
— |
0 |
— |
0 |
|
 Rocky Cherry
 |
Cherry Rocky |
RP |
$390,000 |
390000 |
0.59% |
0.59 |
0.07 |
0.0744631 |
0.19 |
0.19093102564103 |
$5,237,493 |
5237493.46992 |
|
 Brandon Fahey
 |
Fahey Brandon |
SS |
$390,000 |
390000 |
0.59% |
0.59 |
-0.65 |
-0.64566 |
— |
0 |
— |
0 |
|
 Dennis Sarfate
 |
Sarfate Dennis |
RP |
$390,000 |
390000 |
0.59% |
0.59 |
-1.01 |
-1.01392 |
— |
0 |
— |
0 |
Arb1/2011, Arb2/2012, Arb3/2013, FA/2014 |
 Randor Bierd
 |
Bierd Randor |
RP |
$390,000 |
390000 |
0.59% |
0.59 |
-0.19 |
-0.187375 |
— |
0 |
— |
0 |
|
 Troy Patton
 |
Patton Troy |
DNP |
$390,000 |
390000 |
0.59% |
0.59 |
— |
0.00 |
— |
0 |
— |
0 |
|
 Freddie Bynum
 |
Bynum Freddie |
SS |
$390,000 |
390000 |
0.59% |
0.59 |
-1.12 |
-1.12363 |
— |
0 |
— |
0 |
|
| Year | Orioles payroll |
PR Sort |
Avg payroll |
AvgPR Sort |
Diff |
Diff Sort |
|---|
| 2000 | $82,250,111 | 82250111 | $56,164,089 | 56164089 | $26,086,022 | 26086022 |
| 2001 | $73,894,540 | 73894540 | $65,991,638 | 65991638 | $7,902,902 | 7902902 |
| 2002 | $60,496,987 | 60496987 | $68,244,471 | 68244471 | $-7,747,484 | -7747484 |
| 2003 | $73,282,500 | 73282500 | $71,318,479 | 71318479 | $1,964,021 | 1964021 |
| 2004 | $53,273,333 | 53273333 | $70,466,961 | 70466961 | $-17,193,628 | -17193628 |
| 2005 | $73,066,833 | 73066833 | $73,264,780 | 73264780 | $-197,947 | -197947 |
| 2006 | $83,729,266 | 83729266 | $79,051,754 | 79051754 | $4,677,512 | 4677512 |
| 2007 | $94,056,726 | 94056726 | $83,931,138 | 83931138 | $10,125,588 | 10125588 |
| 2008 | $66,644,581 | 66644581 | $90,812,373 | 90812373 | $-24,167,792 | -24167792 |
| 2009 | $68,369,792 | 68369792 | $91,093,211 | 91093211 | $-22,723,419 | -22723419 |
| 2010 | $75,412,500 | 75412500 | $93,373,681 | 93373681 | $-17,961,181 | -17961181 |
| 2011 | $88,184,250 | 88184250 | $96,102,034 | 96102034 | $-7,917,784 | -7917784 |
| 2012 | $84,769,000 | 84769000 | $100,657,138 | 100657138 | $-15,888,138 | -15888138 |
| 2013 | $92,238,334 | 92238334 | $109,024,990 | 109024990 | $-16,786,656 | -16786656 |
| 2014 | $107,976,154 | 107976154 | $117,828,782 | 117828782 | $-9,852,628 | -9852628 |
| 2015 | $118,975,833 | 118975833 | $127,404,244 | 127404244 | $-8,428,411 | -8428411 |
| 2016 | $147,693,714 | 147693714 | $132,219,407 | 132219407 | $15,474,307 | 15474307 |
| 2017 | $164,326,172 | 164326172 | $137,302,894 | 137302894 | $27,023,278 | 27023278 |
| 2018 | $148,574,615 | 148574615 | $136,929,168 | 136929168 | $11,645,447 | 11645447 |
| 2019 | $80,814,882 | 80814882 | $136,944,257 | 136944257 | $-56,129,375 | -56129375 |
| 2020 | $62,285,088 | 62285088 | $140,677,788 | 140677788 | $-78,392,700 | -78392700 |
| 2021 | $62,525,283 | 62525283 | $132,162,631 | 132162631 | $-69,637,348 | -69637348 |
| 2022 | $43,068,167 | 43068167 | $149,374,046 | 149374046 | $-106,305,879 | -106305879 |
| 2023 | $66,889,067 | 66889067 | $160,460,390 | 160460390 | $-93,571,323 | -93571323 |
| 2024 | $52,645,666 | 52645666 | $135,504,022 | 135504022 | $-82,858,356 | -82858356 |
| 2025 | $2,000,000 | 2000000 | $96,417,302 | 96417302 | $-94,417,302 | -94417302 |
|

 See something wrong? Please click
here
here to send us a correction (feedback form opens in a new browser tab).
 2008 Baltimore Orioles


