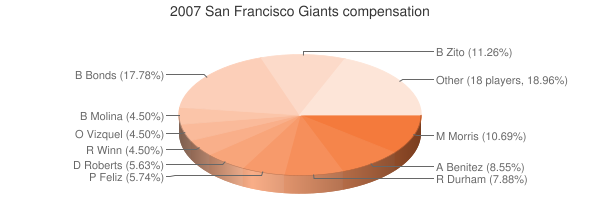
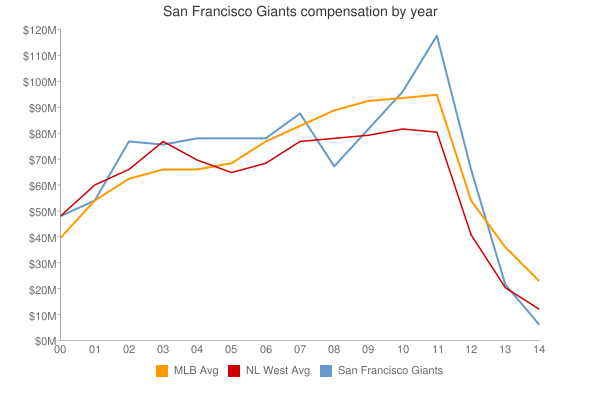
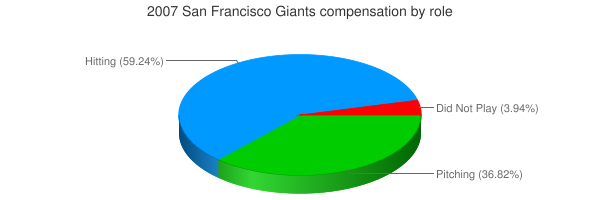
| Player | Player Sort | Pos | Salary | Salary Sort | Pct | Pct Sort | WARP | WARP Sort | WARP/$M | WARP/$M Sort | $/WARP | $/WARP Sort | Current Status |
|---|
 Barry Bonds
 |
Bonds Barry |
LF |
$15,800,000 |
15800000 |
17.62% |
17.62 |
3.86 |
3.85748 |
0.24 |
0.24414430379747 |
$4,095,938 |
4095938.2809503 |
|
 Barry Zito
 |
Zito Barry |
RP |
$10,000,000 |
10000000 |
11.15% |
11.15 |
1.50 |
1.50181 |
0.15 |
0.150181 |
$6,658,632 |
6658631.9174862 |
|
 Armando Benitez
 |
Benitez Armando |
RP |
$9,866,219 |
9866219 |
11.00% |
11.00 |
0.32 |
0.324464 |
0.03 |
0.03288635697221 |
$30,407,746 |
30407746.313921 |
|
 Matt Morris
 |
Morris Matt |
RP |
$9,500,000 |
9500000 |
10.59% |
10.59 |
0.86 |
0.859721 |
0.09 |
0.090496947368421 |
$11,050,096 |
11050096.48479 |
|
 Ray Durham
 |
Durham Ray |
2B |
$7,000,000 |
7000000 |
7.80% |
7.80 |
-0.59 |
-0.591635 |
— |
0 |
— |
0 |
|
 Pedro Feliz
 |
Feliz Pedro |
3B |
$5,100,000 |
5100000 |
5.69% |
5.69 |
1.05 |
1.04753 |
0.21 |
0.20539803921569 |
$4,868,596 |
4868595.648812 |
|
 Dave Roberts
 |
Roberts Dave |
CF |
$5,000,000 |
5000000 |
5.57% |
5.57 |
1.22 |
1.21906 |
0.24 |
0.243812 |
$4,101,521 |
4101520.8439289 |
|
 Omar Vizquel
 |
Vizquel Omar |
SS |
$4,583,333 |
4583333 |
5.11% |
5.11 |
1.65 |
1.64811 |
0.36 |
0.35958766251547 |
$2,780,963 |
2780963.0425154 |
|
 Bengie Molina
 |
Molina Bengie |
C |
$4,000,000 |
4000000 |
4.46% |
4.46 |
2.03 |
2.03243 |
0.51 |
0.5081075 |
$1,968,087 |
1968087.4618068 |
|
 Randy Winn
 |
Winn Randy |
RF |
$4,000,000 |
4000000 |
4.46% |
4.46 |
2.33 |
2.33201 |
0.58 |
0.5830025 |
$1,715,259 |
1715258.5108983 |
|
 Rich Aurilia
 |
Aurilia Rich |
1B |
$3,500,000 |
3500000 |
3.90% |
3.90 |
0.13 |
0.130816 |
0.04 |
0.037376 |
$26,755,137 |
26755136.986301 |
|
 Ryan Klesko
 |
Klesko Ryan |
1B |
$1,750,000 |
1750000 |
1.95% |
1.95 |
0.69 |
0.692723 |
0.40 |
0.39584171428571 |
$2,526,262 |
2526262.3010929 |
|
 Steve Kline
 |
Kline Steve |
RP |
$1,750,000 |
1750000 |
1.95% |
1.95 |
-0.58 |
-0.582573 |
— |
0 |
— |
0 |
|
 Mike Matheny
 |
Matheny Mike |
DNP |
$1,500,000 |
1500000 |
1.67% |
1.67 |
— |
0.00 |
— |
0 |
— |
0 |
|
 Noah Lowry
 |
Lowry Noah |
RP |
$1,115,000 |
1115000 |
1.24% |
1.24 |
-0.57 |
-0.571057 |
— |
0 |
— |
0 |
|
 Mark Sweeney
 |
Sweeney Mark |
PH |
$950,000 |
950000 |
1.06% |
1.06 |
0.38 |
0.377104 |
0.40 |
0.39695157894737 |
$2,519,199 |
2519198.9477704 |
|
 Brad Hennessey
 |
Hennessey Brad |
RP |
$400,000 |
400000 |
0.45% |
0.45 |
0.38 |
0.382027 |
0.96 |
0.9550675 |
$1,047,046 |
1047046.4129499 |
|
 Kevin Correia
 |
Correia Kevin |
RP |
$400,000 |
400000 |
0.45% |
0.45 |
1.97 |
1.96659 |
4.92 |
4.916475 |
$203,398 |
203397.75957368 |
|
 Matt Cain
 |
Cain Matt |
RP |
$400,000 |
400000 |
0.45% |
0.45 |
4.88 |
4.88032 |
12.20 |
12.2008 |
$81,962 |
81961.838567963 |
|
 Vinnie Chulk
 |
Chulk Vinnie |
RP |
$396,000 |
396000 |
0.44% |
0.44 |
0.54 |
0.541997 |
1.37 |
1.3686792929293 |
$730,631 |
730631.35035803 |
|
 Lance Niekro
 |
Niekro Lance |
PH |
$390,000 |
390000 |
0.43% |
0.43 |
-0.31 |
-0.313952 |
— |
0 |
— |
0 |
|
 Todd Linden
 |
Linden Todd |
LF |
$385,000 |
385000 |
0.43% |
0.43 |
-0.45 |
-0.449352 |
— |
0 |
— |
0 |
|
 Eliezer Alfonzo
 |
Alfonzo Eliezer |
C |
$382,000 |
382000 |
0.43% |
0.43 |
-0.06 |
-0.0614738 |
— |
0 |
— |
0 |
|
 Jack Taschner
 |
Taschner Jack |
RP |
$382,000 |
382000 |
0.43% |
0.43 |
0.27 |
0.274392 |
0.72 |
0.71830366492147 |
$1,392,169 |
1392168.867897 |
|
 Jonathan Sánchez
 |
Sanchez Jonathan |
RP |
$381,000 |
381000 |
0.42% |
0.42 |
1.47 |
1.47093 |
3.86 |
3.8607086614173 |
$259,020 |
259019.8037976 |
|
 Kevin Frandsen
 |
Frandsen Kevin |
2B |
$380,500 |
380500 |
0.42% |
0.42 |
-0.04 |
-0.0436322 |
— |
0 |
— |
0 |
|
 Russ Ortiz
 |
Ortiz Russ |
RP |
$380,000 |
380000 |
0.42% |
0.42 |
0.15 |
0.14838 |
0.39 |
0.39047368421053 |
$2,560,992 |
2560992.0474457 |
|
| Year | Giants payroll |
PR Sort |
Avg payroll |
AvgPR Sort |
Diff |
Diff Sort |
|---|
| 2000 | $53,342,826 | 53342826 | $56,164,089 | 56164089 | $-2,821,263 | -2821263 |
| 2001 | $63,289,167 | 63289167 | $65,991,638 | 65991638 | $-2,702,471 | -2702471 |
| 2002 | $78,514,835 | 78514835 | $68,244,471 | 68244471 | $10,270,364 | 10270364 |
| 2003 | $81,302,167 | 81302167 | $71,318,479 | 71318479 | $9,983,688 | 9983688 |
| 2004 | $80,400,833 | 80400833 | $70,466,961 | 70466961 | $9,933,872 | 9933872 |
| 2005 | $88,848,833 | 88848833 | $73,264,780 | 73264780 | $15,584,053 | 15584053 |
| 2006 | $90,017,671 | 90017671 | $79,051,754 | 79051754 | $10,965,917 | 10965917 |
| 2007 | $89,691,052 | 89691052 | $83,931,138 | 83931138 | $5,759,914 | 5759914 |
| 2008 | $75,877,000 | 75877000 | $90,812,373 | 90812373 | $-14,935,373 | -14935373 |
| 2009 | $82,566,450 | 82566450 | $91,093,211 | 91093211 | $-8,526,761 | -8526761 |
| 2010 | $97,023,833 | 97023833 | $93,373,681 | 93373681 | $3,650,152 | 3650152 |
| 2011 | $118,198,333 | 118198333 | $96,102,034 | 96102034 | $22,096,299 | 22096299 |
| 2012 | $131,980,298 | 131980298 | $100,657,138 | 100657138 | $31,323,160 | 31323160 |
| 2013 | $136,908,777 | 136908777 | $109,024,990 | 109024990 | $27,883,787 | 27883787 |
| 2014 | $149,439,474 | 149439474 | $117,828,782 | 117828782 | $31,610,692 | 31610692 |
| 2015 | $173,179,277 | 173179277 | $127,404,244 | 127404244 | $45,775,033 | 45775033 |
| 2016 | $172,086,611 | 172086611 | $132,219,407 | 132219407 | $39,867,204 | 39867204 |
| 2017 | $180,822,611 | 180822611 | $137,302,894 | 137302894 | $43,519,717 | 43519717 |
| 2018 | $200,505,278 | 200505278 | $136,929,168 | 136929168 | $63,576,110 | 63576110 |
| 2019 | $170,179,653 | 170179653 | $136,944,257 | 136944257 | $33,235,396 | 33235396 |
| 2020 | $155,190,747 | 155190747 | $140,677,788 | 140677788 | $14,512,959 | 14512959 |
| 2021 | $149,344,778 | 149344778 | $132,162,631 | 132162631 | $17,182,147 | 17182147 |
| 2022 | $166,189,000 | 166189000 | $149,374,046 | 149374046 | $16,814,954 | 16814954 |
| 2023 | $189,262,500 | 189262500 | $160,460,390 | 160460390 | $28,802,110 | 28802110 |
| 2024 | $189,387,903 | 189387903 | $135,504,022 | 135504022 | $53,883,881 | 53883881 |
| 2025 | $135,000,000 | 135000000 | $96,417,302 | 96417302 | $38,582,698 | 38582698 |
| 2026 | $93,750,000 | 93750000 | $76,694,120 | 76694120 | $17,055,880 | 17055880 |
| 2027 | $35,500,000 | 35500000 | $58,935,617 | 58935617 | $-23,435,617 | -23435617 |
| 2028 | $24,000,000 | 24000000 | $45,437,759 | 45437759 | $-21,437,759 | -21437759 |
|

 See something wrong? Please click
here
here to send us a correction (feedback form opens in a new browser tab).
 2007 San Francisco Giants


