| Player | Player Sort | Pos | Salary | Salary Sort | Pct | Pct Sort | WARP | WARP Sort | WARP/$M | WARP/$M Sort | $/WARP | $/WARP Sort | Current Status |
|---|
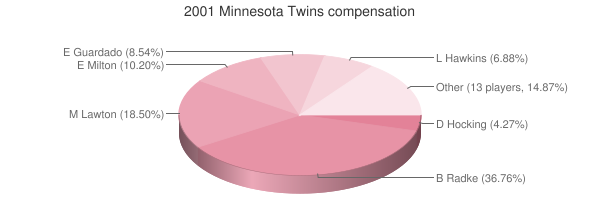
 Brad Radke
 |
Radke Brad |
RP |
$7,750,000 |
7750000 |
32.39% |
32.39 |
5.47 |
5.47452 |
0.71 |
0.70638967741935 |
$1,415,649 |
1415649.2258682 |
|
 Matt Lawton
 |
Lawton Matt |
RF |
$3,900,000 |
3900000 |
16.30% |
16.30 |
1.18 |
1.18426 |
0.30 |
0.30365641025641 |
$3,293,196 |
3293195.7509331 |
|
 Eric Milton
 |
Milton Eric |
RP |
$2,150,000 |
2150000 |
8.98% |
8.98 |
2.14 |
2.14412 |
1.00 |
0.99726511627907 |
$1,002,742 |
1002742.3838218 |
|
 Eddie Guardado
 |
Guardado Eddie |
RP |
$1,800,000 |
1800000 |
7.52% |
7.52 |
1.57 |
1.57098 |
0.87 |
0.87276666666667 |
$1,145,782 |
1145781.6140244 |
|
 LaTroy Hawkins
 |
Hawkins LaTroy |
RP |
$1,450,000 |
1450000 |
6.06% |
6.06 |
-0.51 |
-0.507682 |
— |
0 |
— |
0 |
|
 Bob Wells
 |
Wells Bob |
RP |
$1,100,000 |
1100000 |
4.60% |
4.60 |
0.36 |
0.356245 |
0.32 |
0.32385909090909 |
$3,087,763 |
3087762.6352651 |
|
 Denny Hocking
 |
Hocking Denny |
SS |
$900,000 |
900000 |
3.76% |
3.76 |
-0.22 |
-0.217964 |
— |
0 |
— |
0 |
|
 Tom Prince
 |
Prince Tom |
C |
$400,000 |
400000 |
1.67% |
1.67 |
-0.91 |
-0.913259 |
— |
0 |
— |
0 |
|
 Hector Carrasco
 |
Carrasco Hector |
RP |
$400,000 |
400000 |
1.67% |
1.67 |
1.35 |
1.35174 |
3.38 |
3.37935 |
$295,915 |
295914.89487623 |
|
 Cristian Guzman
 |
Guzman Cristian |
SS |
$325,000 |
325000 |
1.36% |
1.36 |
3.59 |
3.59396 |
11.06 |
11.058338461538 |
$90,429 |
90429.498380616 |
|
 Corey Koskie
 |
Koskie Corey |
3B |
$300,000 |
300000 |
1.25% |
1.25 |
5.78 |
5.77708 |
19.26 |
19.256933333333 |
$51,929 |
51929.348390536 |
|
 Jacque Jones
 |
Jones Jacque |
LF |
$275,000 |
275000 |
1.15% |
1.15 |
1.38 |
1.37917 |
5.02 |
5.0151636363636 |
$199,395 |
199395.2884706 |
|
 Joe Mays
 |
Mays Joe |
RP |
$260,000 |
260000 |
1.09% |
1.09 |
4.09 |
4.08771 |
15.72 |
15.721961538462 |
$63,605 |
63605.294896164 |
|
 David Ortiz
 |
Ortiz David |
DH |
$260,000 |
260000 |
1.09% |
1.09 |
0.42 |
0.422501 |
1.63 |
1.6250038461538 |
$615,383 |
615383.15885643 |
|
 Travis Miller
 |
Miller Travis |
RP |
$255,000 |
255000 |
1.07% |
1.07 |
-0.10 |
-0.0966446 |
— |
0 |
— |
0 |
|
 Chad Allen
 |
Allen Chad |
DH |
$240,000 |
240000 |
1.00% |
1.00 |
0.57 |
0.572426 |
2.39 |
2.3851083333333 |
$419,268 |
419268.16741378 |
|
 Jay Canizaro
 |
Canizaro Jay |
DNP |
$235,000 |
235000 |
0.98% |
0.98 |
— |
0.00 |
— |
0 |
— |
0 |
|
 Mark Redman
 |
Redman Mark |
RP |
$235,000 |
235000 |
0.98% |
0.98 |
0.27 |
0.269185 |
1.15 |
1.1454680851064 |
$873,006 |
873005.55380129 |
|
 Torii Hunter
 |
Hunter Torii |
CF |
$230,000 |
230000 |
0.96% |
0.96 |
4.31 |
4.3074 |
18.73 |
18.727826086957 |
$53,396 |
53396.480475461 |
|
 Jason Maxwell
 |
Maxwell Jason |
SS |
$215,000 |
215000 |
0.90% |
0.90 |
-0.29 |
-0.285686 |
— |
0 |
— |
0 |
|
 Doug Mientkiewicz
 |
Mientkiewicz Doug |
1B |
$215,000 |
215000 |
0.90% |
0.90 |
2.39 |
2.39368 |
11.13 |
11.133395348837 |
$89,820 |
89819.858961933 |
|
 Johan Santana
 |
Santana Johan |
RP |
$212,500 |
212500 |
0.89% |
0.89 |
-0.13 |
-0.130359 |
— |
0 |
— |
0 |
|
 A.J. Pierzynski
 |
Pierzynski A.J. |
C |
$210,000 |
210000 |
0.88% |
0.88 |
2.13 |
2.12898 |
10.14 |
10.138 |
$98,639 |
98638.784770172 |
|
 J.C. Romero
 |
Romero J.C. |
RP |
$207,500 |
207500 |
0.87% |
0.87 |
0.21 |
0.210513 |
1.01 |
1.0145204819277 |
$985,687 |
985687.34472455 |
|
 Brian Buchanan
 |
Buchanan Brian |
RF |
$205,000 |
205000 |
0.86% |
0.86 |
0.66 |
0.658394 |
3.21 |
3.2116780487805 |
$311,364 |
311363.71230601 |
|
 Luis Rivas
 |
Rivas Luis |
2B |
$200,000 |
200000 |
0.84% |
0.84 |
-1.36 |
-1.36127 |
— |
0 |
— |
0 |
|
| Year | Twins payroll |
PR Sort |
Avg payroll |
AvgPR Sort |
Diff |
Diff Sort |
|---|
| 1984 | $50,000 | 50000 | $260,000 | 260000 | $-210,000 | -210000 |
| 1985 | $130,000 | 130000 | $437,500 | 437500 | $-307,500 | -307500 |
| 1986 | $265,000 | 265000 | $552,000 | 552000 | $-287,000 | -287000 |
| 1987 | $465,000 | 465000 | $589,500 | 589500 | $-124,500 | -124500 |
| 1988 | $1,210,000 | 1210000 | $732,083 | 732083 | $477,917 | 477917 |
| 1989 | $2,050,000 | 2050000 | $763,625 | 763625 | $1,286,375 | 1286375 |
| 1990 | $2,700,000 | 2700000 | $1,203,571 | 1203571 | $1,496,429 | 1496429 |
| 1991 | $3,000,000 | 3000000 | $1,884,642 | 1884642 | $1,115,358 | 1115358 |
| 1992 | $3,300,000 | 3300000 | $2,356,071 | 2356071 | $943,929 | 943929 |
| 1993 | $5,200,000 | 5200000 | $3,410,000 | 3410000 | $1,790,000 | 1790000 |
| 1994 | $5,200,000 | 5200000 | $3,447,916 | 3447916 | $1,752,084 | 1752084 |
| 1995 | $6,200,000 | 6200000 | $4,591,041 | 4591041 | $1,608,959 | 1608959 |
| 1996 | $6,200,000 | 6200000 | $4,109,148 | 4109148 | $2,090,852 | 2090852 |
| 1997 | $7,200,000 | 7200000 | $4,753,000 | 4753000 | $2,447,000 | 2447000 |
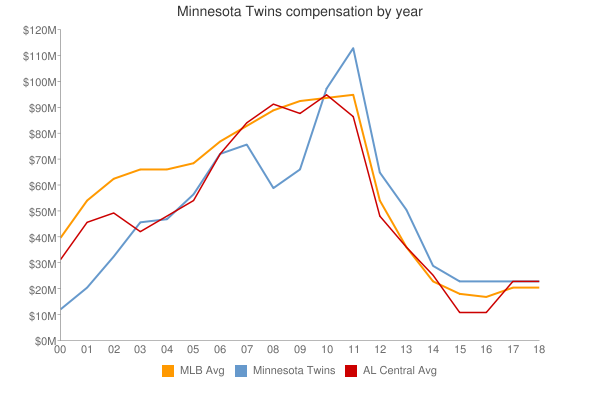
| 2000 | $16,542,500 | 16542500 | $55,368,142 | 55368142 | $-38,825,642 | -38825642 |
| 2001 | $23,930,000 | 23930000 | $64,937,084 | 64937084 | $-41,007,084 | -41007084 |
| 2002 | $39,950,000 | 39950000 | $67,238,672 | 67238672 | $-27,288,672 | -27288672 |
| 2003 | $55,275,000 | 55275000 | $70,654,480 | 70654480 | $-15,379,480 | -15379480 |
| 2004 | $53,815,000 | 53815000 | $69,466,729 | 69466729 | $-15,651,729 | -15651729 |
| 2005 | $56,556,000 | 56556000 | $74,114,841 | 74114841 | $-17,558,841 | -17558841 |
| 2006 | $65,024,500 | 65024500 | $79,621,815 | 79621815 | $-14,597,315 | -14597315 |
| 2007 | $72,189,500 | 72189500 | $85,537,470 | 85537470 | $-13,347,970 | -13347970 |
| 2008 | $61,442,667 | 61442667 | $92,003,799 | 92003799 | $-30,561,132 | -30561132 |
| 2009 | $67,027,267 | 67027267 | $92,169,598 | 92169598 | $-25,142,331 | -25142331 |
| 2010 | $98,159,167 | 98159167 | $94,342,601 | 94342601 | $3,816,566 | 3816566 |
| 2011 | $113,237,000 | 113237000 | $96,974,710 | 96974710 | $16,262,290 | 16262290 |
| 2012 | $100,431,000 | 100431000 | $100,947,217 | 100947217 | $-516,217 | -516217 |
| 2013 | $82,010,000 | 82010000 | $108,586,966 | 108586966 | $-26,576,966 | -26576966 |
| 2014 | $92,874,836 | 92874836 | $117,131,361 | 117131361 | $-24,256,525 | -24256525 |
| 2015 | $108,262,500 | 108262500 | $126,168,161 | 126168161 | $-17,905,661 | -17905661 |
| 2016 | $105,333,700 | 105333700 | $131,756,569 | 131756569 | $-26,422,869 | -26422869 |
| 2017 | $108,102,500 | 108102500 | $136,337,445 | 136337445 | $-28,234,945 | -28234945 |
| 2018 | $128,713,226 | 128713226 | $135,360,600 | 135360600 | $-6,647,374 | -6647374 |
| 2019 | $119,651,933 | 119651933 | $134,792,134 | 134792134 | $-15,140,201 | -15140201 |
| 2020 | $131,799,311 | 131799311 | $139,496,467 | 139496467 | $-7,697,156 | -7697156 |
| 2021 | $131,678,167 | 131678167 | $130,712,288 | 130712288 | $965,879 | 965879 |
| 2022 | $141,020,356 | 141020356 | $149,802,695 | 149802695 | $-8,782,339 | -8782339 |
| 2023 | $154,063,740 | 154063740 | $161,692,345 | 161692345 | $-7,628,605 | -7628605 |
| 2024 | $108,346,590 | 108346590 | $136,306,249 | 136306249 | $-27,959,659 | -27959659 |
| 2025 | $96,981,190 | 96981190 | $98,329,527 | 98329527 | $-1,348,337 | -1348337 |
| 2026 | $70,726,190 | 70726190 | $78,039,273 | 78039273 | $-7,313,083 | -7313083 |
| 2027 | $68,726,190 | 68726190 | $60,919,343 | 60919343 | $7,806,847 | 7806847 |
| 2028 | $46,476,190 | 46476190 | $46,901,712 | 46901712 | $-425,522 | -425522 |
|

 See something wrong? Please click
here
here to send us a correction (feedback form opens in a new browser tab).
 2001 Minnesota Twins


