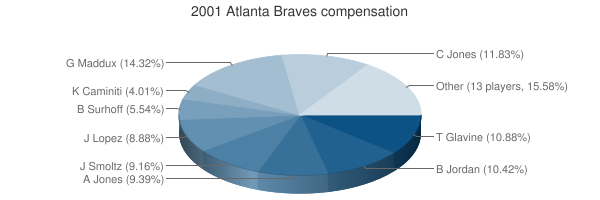
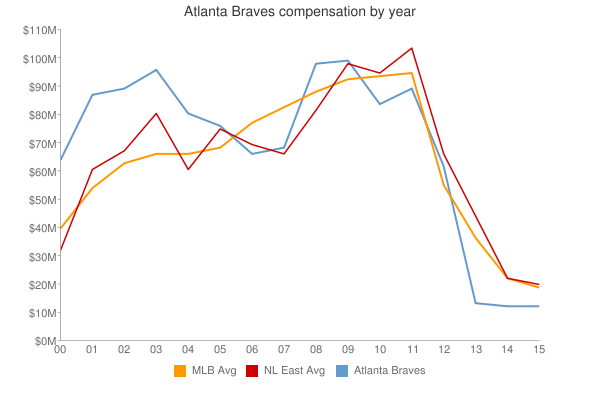
| Player | Player Sort | Pos | Salary | Salary Sort | Pct | Pct Sort | WARP | WARP Sort | WARP/$M | WARP/$M Sort | $/WARP | $/WARP Sort | Current Status |
|---|
 Greg Maddux
 |
Maddux Greg |
RP |
$12,500,000 |
12500000 |
13.74% |
13.74 |
9.46 |
9.46288 |
0.76 |
0.7570304 |
$1,320,951 |
1320950.9155775 |
|
 Chipper Jones
 |
Jones Chipper |
3B |
$10,333,333 |
10333333 |
11.36% |
11.36 |
6.44 |
6.44199 |
0.62 |
0.62341840720705 |
$1,604,059 |
1604059.1494243 |
|
 Tom Glavine
 |
Glavine Tom |
RP |
$9,500,000 |
9500000 |
10.44% |
10.44 |
2.32 |
2.32155 |
0.24 |
0.24437368421053 |
$4,092,094 |
4092093.6443325 |
|
 Brian Jordan
 |
Jordan Brian |
RF |
$9,100,000 |
9100000 |
10.00% |
10.00 |
4.79 |
4.78574 |
0.53 |
0.52590549450549 |
$1,901,482 |
1901482.3203935 |
|
 Andruw Jones
 |
Jones Andruw |
CF |
$8,200,000 |
8200000 |
9.01% |
9.01 |
6.02 |
6.02141 |
0.73 |
0.73431829268293 |
$1,361,807 |
1361807.2843404 |
|
 John Smoltz
 |
Smoltz John |
RP |
$8,000,000 |
8000000 |
8.79% |
8.79 |
1.80 |
1.79895 |
0.22 |
0.22486875 |
$4,447,039 |
4447038.5502654 |
|
 Javy Lopez
 |
Lopez Javy |
C |
$7,750,000 |
7750000 |
8.52% |
8.52 |
3.73 |
3.73211 |
0.48 |
0.48156258064516 |
$2,076,573 |
2076573.3057171 |
|
 B.J. Surhoff
 |
Surhoff B.J. |
LF |
$4,833,333 |
4833333 |
5.31% |
5.31 |
0.79 |
0.791127 |
0.16 |
0.16368145956424 |
$6,109,427 |
6109427.4370613 |
|
 Quilvio Veras
 |
Veras Quilvio |
2B |
$3,900,000 |
3900000 |
4.29% |
4.29 |
1.73 |
1.7251 |
0.44 |
0.44233333333333 |
$2,260,739 |
2260738.5079126 |
|
 Kevin Millwood
 |
Millwood Kevin |
RP |
$3,100,000 |
3100000 |
3.41% |
3.41 |
1.76 |
1.76473 |
0.57 |
0.56926774193548 |
$1,756,643 |
1756642.659217 |
|
 John Rocker
 |
Rocker John |
RP |
$1,900,000 |
1900000 |
2.09% |
2.09 |
0.89 |
0.892419 |
0.47 |
0.46969421052632 |
$2,129,045 |
2129044.764847 |
|
 John Burkett
 |
Burkett John |
RP |
$1,750,000 |
1750000 |
1.92% |
1.92 |
6.53 |
6.52913 |
3.73 |
3.7309314285714 |
$268,030 |
268029.58433972 |
|
 Mike Remlinger
 |
Remlinger Mike |
RP |
$1,600,000 |
1600000 |
1.76% |
1.76 |
2.47 |
2.46729 |
1.54 |
1.54205625 |
$648,485 |
648484.7747934 |
|
 Rico Brogna
 |
Brogna Rico |
1B |
$1,500,000 |
1500000 |
1.65% |
1.65 |
-0.57 |
-0.568322 |
— |
0 |
— |
0 |
|
 Dave Martinez
 |
Martinez Dave |
PH |
$1,500,000 |
1500000 |
1.65% |
1.65 |
0.08 |
0.0753576 |
0.05 |
0.0502384 |
$19,905,093 |
19905092.51887 |
|
 Kerry Ligtenberg
 |
Ligtenberg Kerry |
RP |
$1,200,000 |
1200000 |
1.32% |
1.32 |
1.58 |
1.57844 |
1.32 |
1.3153666666667 |
$760,244 |
760244.29183244 |
|
 Keith Lockhart
 |
Lockhart Keith |
PH |
$800,000 |
800000 |
0.88% |
0.88 |
-0.33 |
-0.331174 |
— |
0 |
— |
0 |
|
 Eddie Pérez
 |
Perez Eddie |
C |
$650,000 |
650000 |
0.71% |
0.71 |
-0.01 |
-0.00902264 |
— |
0 |
— |
0 |
|
 Kurt Abbott
 |
Abbott Kurt |
PH |
$600,000 |
600000 |
0.66% |
0.66 |
-0.06 |
-0.0610756 |
— |
0 |
— |
0 |
|
 Matt Franco
 |
Franco Matt |
DNP |
$462,500 |
462500 |
0.51% |
0.51 |
— |
0.00 |
— |
0 |
— |
0 |
|
 Paul Bako
 |
Bako Paul |
C |
$450,000 |
450000 |
0.49% |
0.49 |
1.33 |
1.33244 |
2.96 |
2.9609777777778 |
$337,726 |
337726.27660533 |
|
 Marc Valdes
 |
Valdes Marc |
RP |
$375,000 |
375000 |
0.41% |
0.41 |
0.01 |
0.014565 |
0.04 |
0.03884 |
$25,746,653 |
25746652.935118 |
|
 Rafael Furcal
 |
Furcal Rafael |
SS |
$355,000 |
355000 |
0.39% |
0.39 |
0.57 |
0.570225 |
1.61 |
1.6062676056338 |
$622,561 |
622561.26967425 |
|
 Odalis Perez
 |
Perez Odalis |
RP |
$220,000 |
220000 |
0.24% |
0.24 |
2.01 |
2.01313 |
9.15 |
9.1505909090909 |
$109,283 |
109282.55999364 |
|
 Wes Helms
 |
Helms Wes |
1B |
$210,000 |
210000 |
0.23% |
0.23 |
0.03 |
0.0293373 |
0.14 |
0.13970142857143 |
$7,158,123 |
7158122.9356485 |
|
 Jason Marquis
 |
Marquis Jason |
RP |
$205,000 |
205000 |
0.23% |
0.23 |
2.25 |
2.24719 |
10.96 |
10.961902439024 |
$91,225 |
91225.041051268 |
|
| Year | Braves payroll |
PR Sort |
Avg payroll |
AvgPR Sort |
Diff |
Diff Sort |
|---|
| 1988 | $62,500 | 62500 | $732,083 | 732083 | $-669,583 | -669583 |
| 1989 | $86,000 | 86000 | $763,625 | 763625 | $-677,625 | -677625 |
| 1990 | $210,000 | 210000 | $1,203,571 | 1203571 | $-993,571 | -993571 |
| 1991 | $355,000 | 355000 | $1,884,642 | 1884642 | $-1,529,642 | -1529642 |
| 1992 | $1,525,000 | 1525000 | $2,356,071 | 2356071 | $-831,071 | -831071 |
| 1993 | $2,500,000 | 2500000 | $3,410,000 | 3410000 | $-910,000 | -910000 |
| 1994 | $3,250,000 | 3250000 | $3,447,916 | 3447916 | $-197,916 | -197916 |
| 1995 | $4,750,000 | 4750000 | $4,591,041 | 4591041 | $158,959 | 158959 |
| 1996 | $5,609,000 | 5609000 | $4,109,148 | 4109148 | $1,499,852 | 1499852 |
| 1997 | $7,000,000 | 7000000 | $4,753,000 | 4753000 | $2,247,000 | 2247000 |
| 1998 | $7,750,000 | 7750000 | $6,661,904 | 6661904 | $1,088,096 | 1088096 |
| 1999 | $7,750,000 | 7750000 | $7,867,823 | 7867823 | $-117,823 | -117823 |
| 2000 | $82,372,500 | 82372500 | $55,368,142 | 55368142 | $27,004,358 | 27004358 |
| 2001 | $90,994,166 | 90994166 | $64,937,084 | 64937084 | $26,057,082 | 26057082 |
| 2002 | $92,460,367 | 92460367 | $67,238,672 | 67238672 | $25,221,695 | 25221695 |
| 2003 | $104,859,000 | 104859000 | $70,654,480 | 70654480 | $34,204,520 | 34204520 |
| 2004 | $90,107,500 | 90107500 | $69,466,729 | 69466729 | $20,640,771 | 20640771 |
| 2005 | $86,457,302 | 86457302 | $74,114,841 | 74114841 | $12,342,461 | 12342461 |
| 2006 | $89,820,876 | 89820876 | $79,621,815 | 79621815 | $10,199,061 | 10199061 |
| 2007 | $87,780,833 | 87780833 | $85,537,470 | 85537470 | $2,243,363 | 2243363 |
| 2008 | $103,069,017 | 103069017 | $92,003,799 | 92003799 | $11,065,218 | 11065218 |
| 2009 | $97,439,334 | 97439334 | $92,169,598 | 92169598 | $5,269,736 | 5269736 |
| 2010 | $84,390,334 | 84390334 | $94,342,601 | 94342601 | $-9,952,267 | -9952267 |
| 2011 | $92,202,417 | 92202417 | $96,974,710 | 96974710 | $-4,772,293 | -4772293 |
| 2012 | $93,529,667 | 93529667 | $100,947,217 | 100947217 | $-7,417,550 | -7417550 |
| 2013 | $90,039,583 | 90039583 | $108,586,966 | 108586966 | $-18,547,383 | -18547383 |
| 2014 | $112,865,874 | 112865874 | $117,131,361 | 117131361 | $-4,265,487 | -4265487 |
| 2015 | $97,443,604 | 97443604 | $126,168,161 | 126168161 | $-28,724,557 | -28724557 |
| 2016 | $86,580,792 | 86580792 | $131,756,569 | 131756569 | $-45,175,777 | -45175777 |
| 2017 | $122,603,054 | 122603054 | $136,337,445 | 136337445 | $-13,734,391 | -13734391 |
| 2018 | $118,284,851 | 118284851 | $135,360,600 | 135360600 | $-17,075,749 | -17075749 |
| 2019 | $128,247,089 | 128247089 | $134,792,134 | 134792134 | $-6,545,045 | -6545045 |
| 2020 | $149,673,875 | 149673875 | $139,496,467 | 139496467 | $10,177,408 | 10177408 |
| 2021 | $131,158,375 | 131158375 | $130,712,288 | 130712288 | $446,087 | 446087 |
| 2022 | $176,255,000 | 176255000 | $149,802,695 | 149802695 | $26,452,305 | 26452305 |
| 2023 | $202,857,500 | 202857500 | $161,692,345 | 161692345 | $41,165,155 | 41165155 |
| 2024 | $226,815,000 | 226815000 | $136,306,249 | 136306249 | $90,508,751 | 90508751 |
| 2025 | $144,750,000 | 144750000 | $98,329,527 | 98329527 | $46,420,473 | 46420473 |
| 2026 | $104,750,000 | 104750000 | $78,039,273 | 78039273 | $26,710,727 | 26710727 |
| 2027 | $85,000,000 | 85000000 | $60,919,343 | 60919343 | $24,080,657 | 24080657 |
| 2028 | $76,000,000 | 76000000 | $46,901,712 | 46901712 | $29,098,288 | 29098288 |
| 2029 | $59,000,000 | 59000000 | $38,597,944 | 38597944 | $20,402,056 | 20402056 |
| 2030 | $34,000,000 | 34000000 | $41,447,579 | 41447579 | $-7,447,579 | -7447579 |
| 2031 | $27,000,000 | 27000000 | $38,360,152 | 38360152 | $-11,360,152 | -11360152 |
| 2032 | $22,000,000 | 22000000 | $47,925,459 | 47925459 | $-25,925,459 | -25925459 |
|

 See something wrong? Please click
here
here to send us a correction (feedback form opens in a new browser tab).
 2001 Atlanta Braves


