| Player | Player Sort | Pos | Salary | Salary Sort | Pct | Pct Sort | WARP | WARP Sort | WARP/$M | WARP/$M Sort | $/WARP | $/WARP Sort | Current Status |
|---|
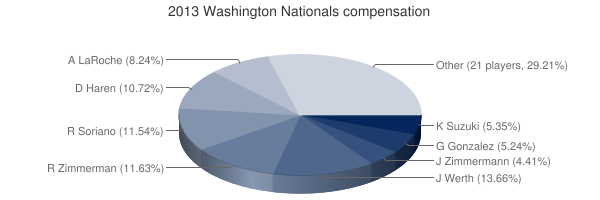
 Jayson Werth
 |
Werth Jayson |
RF |
$16,571,429 |
16571429 |
13.66% |
13.66 |
4.83 |
4.83493 |
0.29 |
0.29176300969578 |
$3,427,439 |
3427439.2804032 |
|
 Ryan Zimmerman
 |
Zimmerman Ryan |
3B |
$14,100,000 |
14100000 |
11.63% |
11.63 |
3.95 |
3.94706 |
0.28 |
0.27993333333333 |
$3,572,279 |
3572279.1140748 |
|
 Rafael Soriano
 |
Soriano Rafael |
RP |
$14,000,000 |
14000000 |
11.54% |
11.54 |
0.35 |
0.352421 |
0.03 |
0.025172928571429 |
$39,725,215 |
39725215.012726 |
|
 Dan Haren
 |
Haren Dan |
RP |
$13,000,000 |
13000000 |
10.72% |
10.72 |
2.72 |
2.72077 |
0.21 |
0.20929 |
$4,778,059 |
4778059.1523723 |
|
 Adam LaRoche
 |
LaRoche Adam |
1B |
$10,000,000 |
10000000 |
8.24% |
8.24 |
0.83 |
0.827339 |
0.08 |
0.0827339 |
$12,086,944 |
12086943.804172 |
|
 Kurt Suzuki
 |
Suzuki Kurt |
C |
$6,487,500 |
6487500 |
5.35% |
5.35 |
0.17 |
0.165841 |
0.03 |
0.025563159922929 |
$39,118,795 |
39118794.507993 |
|
 Gio González
 |
Gonzalez Gio |
RP |
$6,350,000 |
6350000 |
5.24% |
5.24 |
3.51 |
3.51192 |
0.55 |
0.55305826771654 |
$1,808,128 |
1808127.7477847 |
|
 Jordan Zimmermann
 |
Zimmermann Jordan |
RP |
$5,350,000 |
5350000 |
4.41% |
4.41 |
4.31 |
4.314 |
0.81 |
0.80635514018692 |
$1,240,148 |
1240148.3541956 |
|
 Denard Span
 |
Span Denard |
CF |
$4,750,000 |
4750000 |
3.92% |
3.92 |
2.52 |
2.51685 |
0.53 |
0.52986315789474 |
$1,887,280 |
1887279.7345889 |
|
 Tyler Clippard
 |
Clippard Tyler |
RP |
$4,000,000 |
4000000 |
3.30% |
3.30 |
0.79 |
0.793659 |
0.20 |
0.19841475 |
$5,039,948 |
5039947.8869388 |
|
 Stephen Strasburg
 |
Strasburg Stephen |
RP |
$3,900,000 |
3900000 |
3.22% |
3.22 |
5.48 |
5.48025 |
1.41 |
1.4051923076923 |
$711,646 |
711646.36649788 |
|
 Ian Desmond
 |
Desmond Ian |
SS |
$3,800,000 |
3800000 |
3.13% |
3.13 |
3.85 |
3.85057 |
1.01 |
1.0133078947368 |
$986,867 |
986866.87944902 |
|
 Drew Storen
 |
Storen Drew |
RP |
$2,500,000 |
2500000 |
2.06% |
2.06 |
0.68 |
0.67777 |
0.27 |
0.271108 |
$3,688,567 |
3688566.917981 |
|
 Ross Detwiler
 |
Detwiler Ross |
RP |
$2,337,500 |
2337500 |
1.93% |
1.93 |
-0.47 |
-0.473821 |
— |
0 |
— |
0 |
|
 Bryce Harper
 |
Harper Bryce |
LF |
$2,000,000 |
2000000 |
1.65% |
1.65 |
3.91 |
3.9116 |
1.96 |
1.9558 |
$511,300 |
511299.72389815 |
|
 Yunesky Maya
 |
Maya Yunesky |
RP |
$2,000,000 |
2000000 |
1.65% |
1.65 |
0.01 |
0.00730392 |
0.00 |
0.00365196 |
$273,825,562 |
273825562.16388 |
|
 Anthony Rendon
 |
Rendon Anthony |
2B |
$1,800,000 |
1800000 |
1.48% |
1.48 |
1.32 |
1.32159 |
0.73 |
0.73421666666667 |
$1,361,996 |
1361995.7778131 |
|
 Roger Bernadina
 |
Bernadina Roger |
LF |
$1,212,500 |
1212500 |
1.00% |
1.00 |
-0.77 |
-0.768879 |
— |
0 |
— |
0 |
|
 Matt Purke
 |
Purke Matt |
DNP |
$1,037,500 |
1037500 |
0.86% |
0.86 |
— |
0.00 |
— |
0 |
— |
0 |
|
 Chad Tracy
 |
Tracy Chad |
PH |
$1,000,000 |
1000000 |
0.82% |
0.82 |
-0.52 |
-0.518553 |
— |
0 |
— |
0 |
|
 Craig Stammen
 |
Stammen Craig |
RP |
$875,000 |
875000 |
0.72% |
0.72 |
0.91 |
0.907846 |
1.04 |
1.0375382857143 |
$963,820 |
963819.85490931 |
|
 Zach Duke
 |
Duke Zach |
RP |
$700,000 |
700000 |
0.58% |
0.58 |
0.10 |
0.101159 |
0.14 |
0.14451285714286 |
$6,919,800 |
6919799.5235224 |
|
 Danny Espinosa
 |
Espinosa Danny |
2B |
$526,250 |
526250 |
0.43% |
0.43 |
-1.05 |
-1.05442 |
— |
0 |
— |
0 |
|
 Ryan Mattheus
 |
Mattheus Ryan |
RP |
$504,500 |
504500 |
0.42% |
0.42 |
-0.27 |
-0.272981 |
— |
0 |
— |
0 |
|
 Steve Lombardozzi
 |
Lombardozzi Steve |
PH |
$501,250 |
501250 |
0.41% |
0.41 |
0.26 |
0.255817 |
0.51 |
0.51035810473815 |
$1,959,408 |
1959408.4834081 |
|
 Wilson Ramos
 |
Ramos Wilson |
C |
$501,250 |
501250 |
0.41% |
0.41 |
2.49 |
2.48749 |
4.96 |
4.9625735660848 |
$201,508 |
201508.34777225 |
|
 Henry Rodriguez
 |
Rodriguez Henry |
RP |
$501,000 |
501000 |
0.41% |
0.41 |
-0.58 |
-0.584989 |
— |
0 |
— |
0 |
|
 Tyler Moore
 |
Moore Tyler |
LF |
$493,000 |
493000 |
0.41% |
0.41 |
-0.99 |
-0.99492 |
— |
0 |
— |
0 |
|
 Christian Garcia
 |
Garcia Christian |
DNP |
$491,000 |
491000 |
0.40% |
0.40 |
— |
0.00 |
— |
0 |
— |
0 |
|
| Year | Nationals payroll |
PR Sort |
Avg payroll |
AvgPR Sort |
Diff |
Diff Sort |
|---|
| 2005 | $48,613,000 | 48613000 | $73,628,169 | 73628169 | $-25,015,169 | -25015169 |
| 2006 | $62,520,000 | 62520000 | $81,192,832 | 81192832 | $-18,672,832 | -18672832 |
| 2007 | $37,347,500 | 37347500 | $85,747,487 | 85747487 | $-48,399,987 | -48399987 |
| 2008 | $56,261,000 | 56261000 | $93,079,041 | 93079041 | $-36,818,041 | -36818041 |
| 2009 | $59,878,000 | 59878000 | $92,957,049 | 92957049 | $-33,079,049 | -33079049 |
| 2010 | $65,275,000 | 65275000 | $94,957,956 | 94957956 | $-29,682,956 | -29682956 |
| 2011 | $70,794,429 | 70794429 | $97,426,414 | 97426414 | $-26,631,985 | -26631985 |
| 2012 | $92,534,929 | 92534929 | $100,689,500 | 100689500 | $-8,154,571 | -8154571 |
| 2013 | $121,289,679 | 121289679 | $106,658,387 | 106658387 | $14,631,292 | 14631292 |
| 2014 | $137,356,579 | 137356579 | $115,428,670 | 115428670 | $21,927,909 | 21927909 |
| 2015 | $162,014,559 | 162014559 | $125,458,486 | 125458486 | $36,556,073 | 36556073 |
| 2016 | $145,178,886 | 145178886 | $130,290,910 | 130290910 | $14,887,976 | 14887976 |
| 2017 | $164,335,444 | 164335444 | $136,573,000 | 136573000 | $27,762,444 | 27762444 |
| 2018 | $180,849,056 | 180849056 | $135,681,867 | 135681867 | $45,167,189 | 45167189 |
| 2019 | $197,203,691 | 197203691 | $134,776,225 | 134776225 | $62,427,466 | 62427466 |
| 2020 | $173,754,795 | 173754795 | $138,321,485 | 138321485 | $35,433,310 | 35433310 |
| 2021 | $172,772,247 | 172772247 | $129,635,938 | 129635938 | $43,136,309 | 43136309 |
| 2022 | $137,371,867 | 137371867 | $147,002,411 | 147002411 | $-9,630,544 | -9630544 |
| 2023 | $125,965,667 | 125965667 | $158,155,877 | 158155877 | $-32,190,210 | -32190210 |
| 2024 | $113,041,666 | 113041666 | $133,074,721 | 133074721 | $-20,033,055 | -20033055 |
| 2025 | $42,875,000 | 42875000 | $94,180,059 | 94180059 | $-51,305,059 | -51305059 |
| 2026 | $40,375,000 | 40375000 | $74,818,461 | 74818461 | $-34,443,461 | -34443461 |
| 2027 | $5,375,000 | 5375000 | $56,972,319 | 56972319 | $-51,597,319 | -51597319 |
| 2028 | $7,375,000 | 7375000 | $45,437,759 | 45437759 | $-38,062,759 | -38062759 |
| 2029 | $9,375,000 | 9375000 | $37,269,628 | 37269628 | $-27,894,628 | -27894628 |
| 2030 | $9,375,000 | 9375000 | $39,665,769 | 39665769 | $-30,290,769 | -30290769 |
|
 2013 Washington Nationals