| Player | Player Sort | Pos | Salary | Salary Sort | Pct | Pct Sort | WARP | WARP Sort | WARP/$M | WARP/$M Sort | $/WARP | $/WARP Sort | Current Status |
|---|
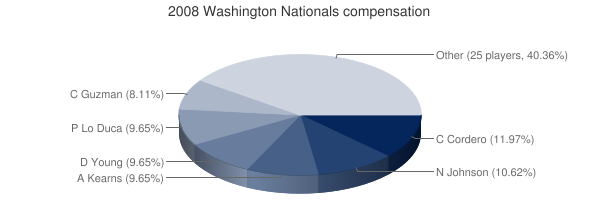
 Chad Cordero
 |
Cordero Chad |
RP |
$6,200,000 |
6200000 |
11.02% |
11.02 |
-0.02 |
-0.0181638 |
— |
0 |
— |
0 |
|
 Nick Johnson
 |
Johnson Nick |
1B |
$5,500,000 |
5500000 |
9.78% |
9.78 |
1.19 |
1.18986 |
0.22 |
0.21633818181818 |
$4,622,393 |
4622392.5503841 |
|
 Dmitri Young
 |
Young Dmitri |
1B |
$5,000,000 |
5000000 |
8.89% |
8.89 |
0.12 |
0.121624 |
0.02 |
0.0243248 |
$41,110,307 |
41110307.176215 |
|
 Austin Kearns
 |
Kearns Austin |
RF |
$5,000,000 |
5000000 |
8.89% |
8.89 |
-0.41 |
-0.413442 |
— |
0 |
— |
0 |
|
 Paul Lo Duca
 |
Lo Duca Paul |
C |
$5,000,000 |
5000000 |
8.89% |
8.89 |
-0.38 |
-0.3789 |
— |
0 |
— |
0 |
|
 Felipe Lopez
 |
Lopez Felipe |
2B |
$4,900,000 |
4900000 |
8.71% |
8.71 |
-0.63 |
-0.62848 |
— |
0 |
— |
0 |
|
 Cristian Guzman
 |
Guzman Cristian |
SS |
$4,200,000 |
4200000 |
7.47% |
7.47 |
4.99 |
4.9931 |
1.19 |
1.1888333333333 |
$841,161 |
841160.80190663 |
|
 Wily Mo Pena
 |
Pena Wily Mo |
LF |
$2,000,000 |
2000000 |
3.55% |
3.55 |
-1.25 |
-1.24955 |
— |
0 |
— |
0 |
|
 Luis Ayala
 |
Ayala Luis |
RP |
$1,700,000 |
1700000 |
3.02% |
3.02 |
0.03 |
0.028294 |
0.02 |
0.016643529411765 |
$60,083,410 |
60083409.910228 |
|
 Ronnie Belliard
 |
Belliard Ronnie |
1B |
$1,600,000 |
1600000 |
2.84% |
2.84 |
1.50 |
1.49514 |
0.93 |
0.9344625 |
$1,070,134 |
1070133.9005043 |
|
 Rob Mackowiak
 |
Mackowiak Rob |
PH |
$1,500,000 |
1500000 |
2.67% |
2.67 |
-0.48 |
-0.475898 |
— |
0 |
— |
0 |
|
 Jesus Colome
 |
Colome Jesus |
RP |
$1,250,000 |
1250000 |
2.22% |
2.22 |
0.17 |
0.168085 |
0.13 |
0.134468 |
$7,436,714 |
7436713.5675402 |
|
 Johnny Estrada
 |
Estrada Johnny |
C |
$1,250,000 |
1250000 |
2.22% |
2.22 |
-0.28 |
-0.283162 |
— |
0 |
— |
0 |
|
 Jon Rauch
 |
Rauch Jon |
RP |
$1,200,000 |
1200000 |
2.13% |
2.13 |
1.15 |
1.14507 |
0.95 |
0.954225 |
$1,047,971 |
1047970.8664099 |
|
 Aaron Boone
 |
Boone Aaron |
1B |
$1,000,000 |
1000000 |
1.78% |
1.78 |
-0.41 |
-0.406572 |
— |
0 |
— |
0 |
|
 Tim Redding
 |
Redding Tim |
RP |
$1,000,000 |
1000000 |
1.78% |
1.78 |
1.35 |
1.35274 |
1.35 |
1.35274 |
$739,240 |
739240.35660955 |
|
 Odalis Perez
 |
Perez Odalis |
RP |
$850,000 |
850000 |
1.51% |
1.51 |
2.28 |
2.27857 |
2.68 |
2.6806705882353 |
$373,041 |
373040.98623259 |
|
 Ray King
 |
King Ray |
RP |
$850,000 |
850000 |
1.51% |
1.51 |
0.09 |
0.0917626 |
0.11 |
0.107956 |
$9,263,033 |
9263033.0875542 |
|
 Willie Harris
 |
Harris Willie |
LF |
$800,000 |
800000 |
1.42% |
1.42 |
2.33 |
2.32657 |
2.91 |
2.9082125 |
$343,854 |
343853.82773783 |
|
 Ryan Langerhans
 |
Langerhans Ryan |
PH |
$500,000 |
500000 |
0.89% |
0.89 |
0.66 |
0.661541 |
1.32 |
1.323082 |
$755,811 |
755811.05328317 |
|
 Ryan Zimmerman
 |
Zimmerman Ryan |
3B |
$465,000 |
465000 |
0.83% |
0.83 |
2.01 |
2.00799 |
4.32 |
4.3182580645161 |
$231,575 |
231574.85844053 |
|
 Ryan Wagner
 |
Wagner Ryan |
DNP |
$450,000 |
450000 |
0.80% |
0.80 |
— |
0.00 |
— |
0 |
— |
0 |
|
 Saul Rivera
 |
Rivera Saul |
RP |
$436,000 |
436000 |
0.77% |
0.77 |
0.96 |
0.955935 |
2.19 |
2.1925114678899 |
$456,098 |
456097.95645101 |
|
 Matt Chico
 |
Chico Matt |
RP |
$409,000 |
409000 |
0.73% |
0.73 |
0.38 |
0.377488 |
0.92 |
0.92295354523227 |
$1,083,478 |
1083478.1502988 |
|
 Jason Bergmann
 |
Bergmann Jason |
RP |
$404,000 |
404000 |
0.72% |
0.72 |
-0.40 |
-0.397646 |
— |
0 |
— |
0 |
Arb2/2011, Arb3/2012, FA/2013 |
 Lastings Milledge
 |
Milledge Lastings |
CF |
$402,500 |
402500 |
0.72% |
0.72 |
0.81 |
0.808236 |
2.01 |
2.0080397515528 |
$497,998 |
497998.10946308 |
|
 Shawn Hill
 |
Hill Shawn |
RP |
$402,000 |
402000 |
0.71% |
0.71 |
0.02 |
0.016242 |
0.04 |
0.040402985074627 |
$24,750,646 |
24750646.472109 |
|
 Jesus Flores
 |
Flores Jesus |
C |
$400,000 |
400000 |
0.71% |
0.71 |
0.01 |
0.0101367 |
0.03 |
0.02534175 |
$39,460,574 |
39460573.954048 |
|
 Joel Hanrahan
 |
Hanrahan Joel |
RP |
$400,000 |
400000 |
0.71% |
0.71 |
0.72 |
0.723101 |
1.81 |
1.8077525 |
$553,173 |
553173.06987544 |
|
 Wil Nieves
 |
Nieves Wil |
C |
$400,000 |
400000 |
0.71% |
0.71 |
1.33 |
1.33069 |
3.33 |
3.326725 |
$300,596 |
300595.93143407 |
|
 Michael O'Connor
 |
O'Connor Michael |
RP |
$400,000 |
400000 |
0.71% |
0.71 |
-0.09 |
-0.0853924 |
— |
0 |
— |
0 |
|
 Elijah Dukes
 |
Dukes Elijah |
RF |
$392,500 |
392500 |
0.70% |
0.70 |
2.67 |
2.66591 |
6.79 |
6.792127388535 |
$147,229 |
147229.27630715 |
Arb1/2011, Arb2/2012, Arb3/2013, FA/2014 |
| Year | Nationals payroll |
PR Sort |
Avg payroll |
AvgPR Sort |
Diff |
Diff Sort |
|---|
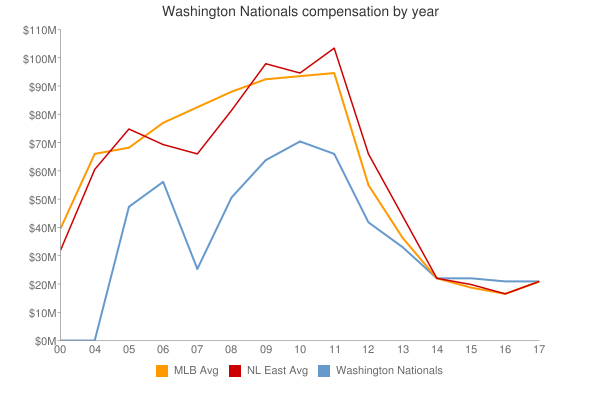
| 2005 | $48,613,000 | 48613000 | $73,264,780 | 73264780 | $-24,651,780 | -24651780 |
| 2006 | $62,520,000 | 62520000 | $79,051,754 | 79051754 | $-16,531,754 | -16531754 |
| 2007 | $37,347,500 | 37347500 | $83,931,138 | 83931138 | $-46,583,638 | -46583638 |
| 2008 | $56,261,000 | 56261000 | $90,812,373 | 90812373 | $-34,551,373 | -34551373 |
| 2009 | $59,878,000 | 59878000 | $91,093,211 | 91093211 | $-31,215,211 | -31215211 |
| 2010 | $65,275,000 | 65275000 | $93,373,681 | 93373681 | $-28,098,681 | -28098681 |
| 2011 | $70,794,429 | 70794429 | $96,102,034 | 96102034 | $-25,307,605 | -25307605 |
| 2012 | $92,534,929 | 92534929 | $100,657,138 | 100657138 | $-8,122,209 | -8122209 |
| 2013 | $121,289,679 | 121289679 | $109,024,990 | 109024990 | $12,264,689 | 12264689 |
| 2014 | $137,356,579 | 137356579 | $117,828,782 | 117828782 | $19,527,797 | 19527797 |
| 2015 | $162,014,559 | 162014559 | $127,404,244 | 127404244 | $34,610,315 | 34610315 |
| 2016 | $145,178,886 | 145178886 | $132,219,407 | 132219407 | $12,959,479 | 12959479 |
| 2017 | $164,335,444 | 164335444 | $137,302,894 | 137302894 | $27,032,550 | 27032550 |
| 2018 | $180,849,056 | 180849056 | $136,929,168 | 136929168 | $43,919,888 | 43919888 |
| 2019 | $197,203,691 | 197203691 | $136,944,257 | 136944257 | $60,259,434 | 60259434 |
| 2020 | $173,754,795 | 173754795 | $140,677,788 | 140677788 | $33,077,007 | 33077007 |
| 2021 | $172,772,247 | 172772247 | $132,162,631 | 132162631 | $40,609,616 | 40609616 |
| 2022 | $137,371,867 | 137371867 | $149,374,046 | 149374046 | $-12,002,179 | -12002179 |
| 2023 | $125,965,667 | 125965667 | $160,460,390 | 160460390 | $-34,494,723 | -34494723 |
| 2024 | $113,041,666 | 113041666 | $135,504,022 | 135504022 | $-22,462,356 | -22462356 |
| 2025 | $42,875,000 | 42875000 | $96,417,302 | 96417302 | $-53,542,302 | -53542302 |
| 2026 | $40,375,000 | 40375000 | $76,694,120 | 76694120 | $-36,319,120 | -36319120 |
| 2027 | $5,375,000 | 5375000 | $58,935,617 | 58935617 | $-53,560,617 | -53560617 |
| 2028 | $7,375,000 | 7375000 | $45,437,759 | 45437759 | $-38,062,759 | -38062759 |
| 2029 | $9,375,000 | 9375000 | $37,269,628 | 37269628 | $-27,894,628 | -27894628 |
| 2030 | $9,375,000 | 9375000 | $39,665,769 | 39665769 | $-30,290,769 | -30290769 |
|
 2008 Washington Nationals