| Player | Player Sort | Pos | Salary | Salary Sort | Pct | Pct Sort | WARP | WARP Sort | WARP/$M | WARP/$M Sort | $/WARP | $/WARP Sort | Current Status |
|---|
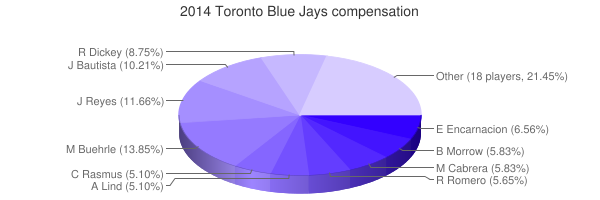
 Mark Buehrle
 |
Buehrle Mark |
RP |
$19,000,000 |
19000000 |
13.85% |
13.85 |
1.58 |
1.57872 |
0.08 |
0.083090526315789 |
$12,035,066 |
12035066.382892 |
|
 José Reyes
 |
Reyes Jose |
SS |
$16,000,000 |
16000000 |
11.66% |
11.66 |
3.09 |
3.09396 |
0.19 |
0.1933725 |
$5,171,366 |
5171366.1456515 |
|
 José Bautista
 |
Bautista Jose |
RF |
$14,000,000 |
14000000 |
10.21% |
10.21 |
6.69 |
6.68659 |
0.48 |
0.47761357142857 |
$2,093,743 |
2093742.8494943 |
|
 R.A. Dickey
 |
Dickey R.A. |
RP |
$12,000,000 |
12000000 |
8.75% |
8.75 |
2.42 |
2.42496 |
0.20 |
0.20208 |
$4,948,535 |
4948535.2335709 |
|
 Edwin Encarnación
 |
Encarnacion Edwin |
1B |
$9,000,000 |
9000000 |
6.56% |
6.56 |
2.86 |
2.86147 |
0.32 |
0.31794111111111 |
$3,145,237 |
3145236.5392613 |
|
 Melky Cabrera
 |
Cabrera Melky |
LF |
$8,000,000 |
8000000 |
5.83% |
5.83 |
3.68 |
3.68098 |
0.46 |
0.4601225 |
$2,173,334 |
2173334.2751115 |
|
 Brandon Morrow
 |
Morrow Brandon |
RP |
$8,000,000 |
8000000 |
5.83% |
5.83 |
0.15 |
0.147016 |
0.02 |
0.018377 |
$54,415,846 |
54415845.894324 |
|
 Ricky Romero
 |
Romero Ricky |
DNP |
$7,750,000 |
7750000 |
5.65% |
5.65 |
— |
0.00 |
— |
0 |
— |
0 |
|
 Adam Lind
 |
Lind Adam |
1B |
$7,000,000 |
7000000 |
5.10% |
5.10 |
2.11 |
2.10549 |
0.30 |
0.30078428571429 |
$3,324,642 |
3324641.7698493 |
|
 Colby Rasmus
 |
Rasmus Colby |
CF |
$7,000,000 |
7000000 |
5.10% |
5.10 |
1.67 |
1.6738 |
0.24 |
0.23911428571429 |
$4,182,101 |
4182100.6093918 |
|
 J.A. Happ
 |
Happ J.A. |
RP |
$5,200,000 |
5200000 |
3.79% |
3.79 |
-0.37 |
-0.373533 |
— |
0 |
— |
0 |
|
 Casey Janssen
 |
Janssen Casey |
RP |
$4,000,000 |
4000000 |
2.92% |
2.92 |
0.17 |
0.174579 |
0.04 |
0.04364475 |
$22,912,263 |
22912263.21608 |
|
 Sergio Santos
 |
Santos Sergio |
RP |
$3,750,000 |
3750000 |
2.73% |
2.73 |
0.53 |
0.534032 |
0.14 |
0.14240853333333 |
$7,022,051 |
7022051.1130419 |
|
 Dioner Navarro
 |
Navarro Dioner |
C |
$3,000,000 |
3000000 |
2.19% |
2.19 |
0.32 |
0.317341 |
0.11 |
0.10578033333333 |
$9,453,553 |
9453553.1179394 |
|
 Maicer Izturis
 |
Izturis Maicer |
2B |
$3,000,000 |
3000000 |
2.19% |
2.19 |
-0.03 |
-0.0286882 |
— |
0 |
— |
0 |
|
 Esmil Rogers
 |
Rogers Esmil |
RP |
$1,850,000 |
1850000 |
1.35% |
1.35 |
0.14 |
0.139612 |
0.08 |
0.075465945945946 |
$13,251,010 |
13251009.941839 |
|
 Dustin McGowan
 |
McGowan Dustin |
RP |
$1,500,000 |
1500000 |
1.09% |
1.09 |
-1.51 |
-1.50858 |
— |
0 |
— |
0 |
|
 Brett Cecil
 |
Cecil Brett |
RP |
$1,300,000 |
1300000 |
0.95% |
0.95 |
1.13 |
1.12653 |
0.87 |
0.86656153846154 |
$1,153,986 |
1153986.1344128 |
|
 Josh Thole
 |
Thole Josh |
C |
$1,250,000 |
1250000 |
0.91% |
0.91 |
0.44 |
0.436606 |
0.35 |
0.3492848 |
$2,862,993 |
2862993.179205 |
|
 Brett Lawrie
 |
Lawrie Brett |
3B |
$516,100 |
516100 |
0.38% |
0.38 |
1.28 |
1.27907 |
2.48 |
2.4783375314861 |
$403,496 |
403496.2902734 |
|
 Steve Delabar
 |
Delabar Steve |
RP |
$515,900 |
515900 |
0.38% |
0.38 |
-0.85 |
-0.851938 |
— |
0 |
— |
0 |
|
 Aaron Loup
 |
Loup Aaron |
RP |
$512,400 |
512400 |
0.37% |
0.37 |
0.31 |
0.305835 |
0.60 |
0.59686768149883 |
$1,675,413 |
1675413.213007 |
|
 Erik Kratz
 |
Kratz Erik |
C |
$510,200 |
510200 |
0.37% |
0.37 |
0.08 |
0.0769028 |
0.15 |
0.15073069384555 |
$6,634,349 |
6634348.8143475 |
|
 Jeremy Jeffress
 |
Jeffress Jeremy |
RP |
$507,600 |
507600 |
0.37% |
0.37 |
0.10 |
0.10043 |
0.20 |
0.19785263987392 |
$5,054,267 |
5054266.6533904 |
|
 Todd Redmond
 |
Redmond Todd |
RP |
$505,700 |
505700 |
0.37% |
0.37 |
-1.19 |
-1.18637 |
— |
0 |
— |
0 |
|
 Moisés Sierra
 |
Sierra Moises |
RF |
$504,700 |
504700 |
0.37% |
0.37 |
-0.77 |
-0.765618 |
— |
0 |
— |
0 |
|
 Drew Hutchison
 |
Hutchison Drew |
RP |
$503,200 |
503200 |
0.37% |
0.37 |
-0.50 |
-0.499642 |
— |
0 |
— |
0 |
|
 Ryan Goins
 |
Goins Ryan |
2B |
$501,900 |
501900 |
0.37% |
0.37 |
-0.68 |
-0.681441 |
— |
0 |
— |
0 |
|
| Year | Blue Jays payroll |
PR Sort |
Avg payroll |
AvgPR Sort |
Diff |
Diff Sort |
|---|
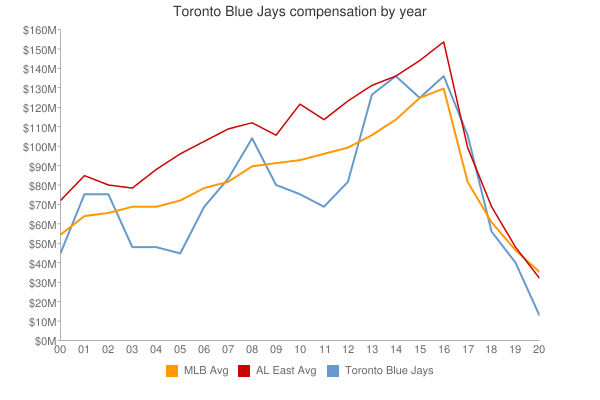
| 2000 | $45,518,332 | 45518332 | $57,491,092 | 57491092 | $-11,972,760 | -11972760 |
| 2001 | $76,322,999 | 76322999 | $67,120,750 | 67120750 | $9,202,249 | 9202249 |
| 2002 | $76,464,333 | 76464333 | $69,204,705 | 69204705 | $7,259,628 | 7259628 |
| 2003 | $49,679,000 | 49679000 | $72,156,639 | 72156639 | $-22,477,639 | -22477639 |
| 2004 | $49,018,000 | 49018000 | $71,426,357 | 71426357 | $-22,408,357 | -22408357 |
| 2005 | $45,801,500 | 45801500 | $73,628,169 | 73628169 | $-27,826,669 | -27826669 |
| 2006 | $69,295,000 | 69295000 | $81,192,832 | 81192832 | $-11,897,832 | -11897832 |
| 2007 | $84,315,000 | 84315000 | $85,747,487 | 85747487 | $-1,432,487 | -1432487 |
| 2008 | $104,368,800 | 104368800 | $93,079,041 | 93079041 | $11,289,759 | 11289759 |
| 2009 | $81,842,100 | 81842100 | $92,957,049 | 92957049 | $-11,114,949 | -11114949 |
| 2010 | $76,189,000 | 76189000 | $94,957,956 | 94957956 | $-18,768,956 | -18768956 |
| 2011 | $70,317,800 | 70317800 | $97,426,414 | 97426414 | $-27,108,614 | -27108614 |
| 2012 | $83,739,200 | 83739200 | $100,689,500 | 100689500 | $-16,950,300 | -16950300 |
| 2013 | $127,777,800 | 127777800 | $106,658,387 | 106658387 | $21,119,413 | 21119413 |
| 2014 | $137,177,700 | 137177700 | $115,428,670 | 115428670 | $21,749,030 | 21749030 |
| 2015 | $125,915,800 | 125915800 | $125,458,486 | 125458486 | $457,314 | 457314 |
| 2016 | $136,782,027 | 136782027 | $130,290,910 | 130290910 | $6,491,117 | 6491117 |
| 2017 | $163,381,937 | 163381937 | $136,573,000 | 136573000 | $26,808,937 | 26808937 |
| 2018 | $162,037,223 | 162037223 | $135,681,867 | 135681867 | $26,355,356 | 26355356 |
| 2019 | $117,546,171 | 117546171 | $134,776,225 | 134776225 | $-17,230,054 | -17230054 |
| 2020 | $108,987,471 | 108987471 | $138,321,485 | 138321485 | $-29,334,014 | -29334014 |
| 2021 | $140,375,671 | 140375671 | $129,635,938 | 129635938 | $10,739,733 | 10739733 |
| 2022 | $166,851,121 | 166851121 | $147,002,411 | 147002411 | $19,848,710 | 19848710 |
| 2023 | $186,938,983 | 186938983 | $158,155,877 | 158155877 | $28,783,106 | 28783106 |
| 2024 | $181,399,600 | 181399600 | $133,074,721 | 133074721 | $48,324,879 | 48324879 |
| 2025 | $130,750,000 | 130750000 | $94,180,059 | 94180059 | $36,569,941 | 36569941 |
| 2026 | $95,166,667 | 95166667 | $74,818,461 | 74818461 | $20,348,206 | 20348206 |
| 2027 | $30,000,000 | 30000000 | $56,972,319 | 56972319 | $-26,972,319 | -26972319 |
| 2028 | $30,000,000 | 30000000 | $45,437,759 | 45437759 | $-15,437,759 | -15437759 |
|
 2014 Toronto Blue Jays