| Player | Player Sort | Pos | Salary | Salary Sort | Pct | Pct Sort | WARP | WARP Sort | WARP/$M | WARP/$M Sort | $/WARP | $/WARP Sort | Current Status |
|---|
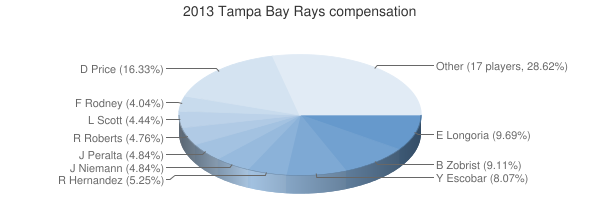
 David Price
 |
Price David |
RP |
$10,112,500 |
10112500 |
16.33% |
16.33 |
4.35 |
4.34549 |
0.43 |
0.42971470951792 |
$2,327,125 |
2327125.3644583 |
|
 Evan Longoria
 |
Longoria Evan |
3B |
$6,000,000 |
6000000 |
9.69% |
9.69 |
6.11 |
6.10578 |
1.02 |
1.01763 |
$982,675 |
982675.43213152 |
|
 Ben Zobrist
 |
Zobrist Ben |
2B |
$5,640,475 |
5640475 |
9.11% |
9.11 |
3.42 |
3.42214 |
0.61 |
0.60671131420669 |
$1,648,230 |
1648230.3470928 |
|
 Yunel Escobar
 |
Escobar Yunel |
SS |
$5,000,000 |
5000000 |
8.07% |
8.07 |
2.67 |
2.67069 |
0.53 |
0.534138 |
$1,872,175 |
1872175.3554325 |
|
 Roberto Hernandez
 |
Hernandez Roberto |
RP |
$3,250,000 |
3250000 |
5.25% |
5.25 |
0.27 |
0.268848 |
0.08 |
0.082722461538462 |
$12,088,615 |
12088615.128251 |
|
 Joel Peralta
 |
Peralta Joel |
RP |
$3,000,000 |
3000000 |
4.84% |
4.84 |
0.29 |
0.288773 |
0.10 |
0.096257666666667 |
$10,388,783 |
10388782.884826 |
|
 Jeff Niemann
 |
Niemann Jeff |
DNP |
$3,000,000 |
3000000 |
4.84% |
4.84 |
— |
0.00 |
— |
0 |
— |
0 |
|
 Ryan Roberts
 |
Roberts Ryan |
2B |
$2,950,000 |
2950000 |
4.76% |
4.76 |
0.17 |
0.168612 |
0.06 |
0.057156610169492 |
$17,495,789 |
17495789.149052 |
|
 Luke Scott
 |
Scott Luke |
DH |
$2,750,000 |
2750000 |
4.44% |
4.44 |
0.79 |
0.788823 |
0.29 |
0.28684472727273 |
$3,486,207 |
3486206.6648665 |
|
 Fernando Rodney
 |
Rodney Fernando |
RP |
$2,500,000 |
2500000 |
4.04% |
4.04 |
1.28 |
1.27941 |
0.51 |
0.511764 |
$1,954,026 |
1954025.6837136 |
|
 Kelly Johnson
 |
Johnson Kelly |
LF |
$2,450,000 |
2450000 |
3.96% |
3.96 |
1.84 |
1.83865 |
0.75 |
0.7504693877551 |
$1,332,499 |
1332499.388138 |
|
 Matt Joyce
 |
Joyce Matt |
RF |
$2,450,000 |
2450000 |
3.96% |
3.96 |
1.39 |
1.38805 |
0.57 |
0.56655102040816 |
$1,765,066 |
1765066.0999244 |
|
 James Loney
 |
Loney James |
1B |
$2,000,000 |
2000000 |
3.23% |
3.23 |
1.42 |
1.41752 |
0.71 |
0.70876 |
$1,410,915 |
1410914.8371804 |
|
 José Molina
 |
Molina Jose |
C |
$1,800,000 |
1800000 |
2.91% |
2.91 |
2.13 |
2.12609 |
1.18 |
1.1811611111111 |
$846,625 |
846624.55493417 |
|
 Kyle Farnsworth
 |
Farnsworth Kyle |
RP |
$1,250,000 |
1250000 |
2.02% |
2.02 |
-0.09 |
-0.0885562 |
— |
0 |
— |
0 |
|
 Matt Moore
 |
Moore Matt |
RP |
$1,100,000 |
1100000 |
1.78% |
1.78 |
1.43 |
1.43102 |
1.30 |
1.3009272727273 |
$768,682 |
768682.47823231 |
|
 Sean Rodríguez
 |
Rodriguez Sean |
LF |
$1,000,000 |
1000000 |
1.61% |
1.61 |
0.68 |
0.675636 |
0.68 |
0.675636 |
$1,480,087 |
1480086.9107034 |
|
 Jamey Wright
 |
Wright Jamey |
RP |
$900,000 |
900000 |
1.45% |
1.45 |
1.77 |
1.77004 |
1.97 |
1.9667111111111 |
$508,463 |
508463.08557999 |
|
 Sam Fuld
 |
Fuld Sam |
LF |
$725,000 |
725000 |
1.17% |
1.17 |
-0.64 |
-0.640819 |
— |
0 |
— |
0 |
|
 Shelley Duncan
 |
Duncan Shelley |
DH |
$550,000 |
550000 |
0.89% |
0.89 |
-0.37 |
-0.368118 |
— |
0 |
— |
0 |
|
 Jake McGee
 |
McGee Jake |
RP |
$506,200 |
506200 |
0.82% |
0.82 |
1.20 |
1.19758 |
2.37 |
2.3658237850652 |
$422,686 |
422685.74959502 |
|
 Jeremy Hellickson
 |
Hellickson Jeremy |
RP |
$503,000 |
503000 |
0.81% |
0.81 |
1.81 |
1.80699 |
3.59 |
3.5924254473161 |
$278,363 |
278363.46631691 |
|
 Alex Cobb
 |
Cobb Alex |
RP |
$502,200 |
502200 |
0.81% |
0.81 |
2.12 |
2.12436 |
4.23 |
4.2301075268817 |
$236,401 |
236400.61006609 |
|
 Desmond Jennings
 |
Jennings Desmond |
CF |
$501,800 |
501800 |
0.81% |
0.81 |
3.93 |
3.93187 |
7.84 |
7.8355320844958 |
$127,624 |
127623.75154825 |
|
 César Ramos
 |
Ramos Cesar |
RP |
$501,300 |
501300 |
0.81% |
0.81 |
-0.03 |
-0.0250395 |
— |
0 |
— |
0 |
|
 Jose Lobaton
 |
Lobaton Jose |
C |
$496,500 |
496500 |
0.80% |
0.80 |
2.30 |
2.29765 |
4.63 |
4.627693856999 |
$216,090 |
216090.35318695 |
|
 Juan Carlos Oviedo
 |
Oviedo Juan Carlos |
DNP |
$490,000 |
490000 |
0.79% |
0.79 |
— |
0.00 |
— |
0 |
— |
0 |
|
| Year | Rays payroll |
PR Sort |
Avg payroll |
AvgPR Sort |
Diff |
Diff Sort |
|---|
| 2000 | $62,815,129 | 62815129 | $57,491,092 | 57491092 | $5,324,037 | 5324037 |
| 2001 | $56,725,000 | 56725000 | $67,120,750 | 67120750 | $-10,395,750 | -10395750 |
| 2002 | $34,380,000 | 34380000 | $69,204,705 | 69204705 | $-34,824,705 | -34824705 |
| 2003 | $19,130,000 | 19130000 | $72,156,639 | 72156639 | $-53,026,639 | -53026639 |
| 2004 | $29,754,167 | 29754167 | $71,426,357 | 71426357 | $-41,672,190 | -41672190 |
| 2005 | $30,445,567 | 30445567 | $73,628,169 | 73628169 | $-43,182,602 | -43182602 |
| 2006 | $38,319,967 | 38319967 | $81,192,832 | 81192832 | $-42,872,865 | -42872865 |
| 2007 | $25,790,800 | 25790800 | $85,747,487 | 85747487 | $-59,956,687 | -59956687 |
| 2008 | $47,124,500 | 47124500 | $93,079,041 | 93079041 | $-45,954,541 | -45954541 |
| 2009 | $65,401,368 | 65401368 | $92,957,049 | 92957049 | $-27,555,681 | -27555681 |
| 2010 | $74,487,608 | 74487608 | $94,957,956 | 94957956 | $-20,470,348 | -20470348 |
| 2011 | $41,901,308 | 41901308 | $97,426,414 | 97426414 | $-55,525,106 | -55525106 |
| 2012 | $63,626,675 | 63626675 | $100,689,500 | 100689500 | $-37,062,825 | -37062825 |
| 2013 | $61,928,975 | 61928975 | $106,658,387 | 106658387 | $-44,729,412 | -44729412 |
| 2014 | $76,872,383 | 76872383 | $115,428,670 | 115428670 | $-38,556,287 | -38556287 |
| 2015 | $77,294,234 | 77294234 | $125,458,486 | 125458486 | $-48,164,252 | -48164252 |
| 2016 | $66,681,991 | 66681991 | $130,290,910 | 130290910 | $-63,608,919 | -63608919 |
| 2017 | $70,612,800 | 70612800 | $136,573,000 | 136573000 | $-65,960,200 | -65960200 |
| 2018 | $76,007,496 | 76007496 | $135,681,867 | 135681867 | $-59,674,371 | -59674371 |
| 2019 | $60,084,133 | 60084133 | $134,776,225 | 134776225 | $-74,692,092 | -74692092 |
| 2020 | $69,303,833 | 69303833 | $138,321,485 | 138321485 | $-69,017,652 | -69017652 |
| 2021 | $63,714,834 | 63714834 | $129,635,938 | 129635938 | $-65,921,104 | -65921104 |
| 2022 | $85,728,178 | 85728178 | $147,002,411 | 147002411 | $-61,274,233 | -61274233 |
| 2023 | $73,184,811 | 73184811 | $158,155,877 | 158155877 | $-84,971,066 | -84971066 |
| 2024 | $56,128,512 | 56128512 | $133,074,721 | 133074721 | $-76,946,209 | -76946209 |
| 2025 | $51,971,212 | 51971212 | $94,180,059 | 94180059 | $-42,208,847 | -42208847 |
| 2026 | $26,954,545 | 26954545 | $74,818,461 | 74818461 | $-47,863,916 | -47863916 |
| 2027 | $23,204,545 | 23204545 | $56,972,319 | 56972319 | $-33,767,774 | -33767774 |
| 2028 | $25,454,546 | 25454546 | $45,437,759 | 45437759 | $-19,983,213 | -19983213 |
| 2029 | $25,454,546 | 25454546 | $37,269,628 | 37269628 | $-11,815,082 | -11815082 |
| 2030 | $25,454,546 | 25454546 | $39,665,769 | 39665769 | $-14,211,223 | -14211223 |
| 2031 | $25,454,546 | 25454546 | $38,360,152 | 38360152 | $-12,905,606 | -12905606 |
| 2032 | $25,454,546 | 25454546 | $47,925,459 | 47925459 | $-22,470,913 | -22470913 |
| 2033 | $2,000,000 | 2000000 | $43,068,924 | 43068924 | $-41,068,924 | -41068924 |
|
 2013 Tampa Bay Rays