| Player | Player Sort | Pos | Salary | Salary Sort | Pct | Pct Sort | WARP | WARP Sort | WARP/$M | WARP/$M Sort | $/WARP | $/WARP Sort | Current Status |
|---|
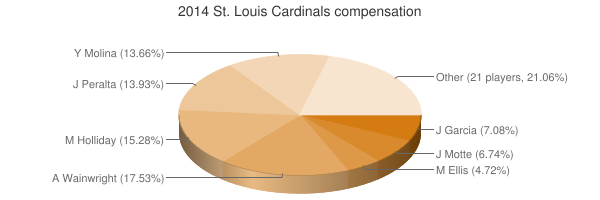
 Adam Wainwright
 |
Wainwright Adam |
RP |
$19,500,000 |
19500000 |
17.53% |
17.53 |
6.18 |
6.17605 |
0.32 |
0.31672051282051 |
$3,157,358 |
3157357.858178 |
|
 Matt Holliday
 |
Holliday Matt |
LF |
$17,000,000 |
17000000 |
15.28% |
15.28 |
2.52 |
2.52463 |
0.15 |
0.14850764705882 |
$6,733,660 |
6733659.9818587 |
|
 Jhonny Peralta
 |
Peralta Jhonny |
SS |
$15,500,000 |
15500000 |
13.93% |
13.93 |
4.27 |
4.27103 |
0.28 |
0.27555032258065 |
$3,629,101 |
3629101.1769995 |
|
 Yadier Molina
 |
Molina Yadier |
C |
$15,200,000 |
15200000 |
13.66% |
13.66 |
2.27 |
2.27464 |
0.15 |
0.14964736842105 |
$6,682,376 |
6682376.1122639 |
|
 Jaime García
 |
Garcia Jaime |
RP |
$7,875,000 |
7875000 |
7.08% |
7.08 |
1.13 |
1.12577 |
0.14 |
0.14295492063492 |
$6,995,212 |
6995212.1658953 |
|
 Jason Motte
 |
Motte Jason |
RP |
$7,500,000 |
7500000 |
6.74% |
6.74 |
-0.26 |
-0.259768 |
— |
0 |
— |
0 |
|
 Mark Ellis
 |
Ellis Mark |
2B |
$5,250,000 |
5250000 |
4.72% |
4.72 |
-0.85 |
-0.849909 |
— |
0 |
— |
0 |
|
 Jon Jay
 |
Jay Jon |
CF |
$3,250,000 |
3250000 |
2.92% |
2.92 |
0.98 |
0.979253 |
0.30 |
0.30130861538462 |
$3,318,856 |
3318856.3119031 |
|
 Randy Choate
 |
Choate Randy |
RP |
$3,000,000 |
3000000 |
2.70% |
2.70 |
-0.52 |
-0.516706 |
— |
0 |
— |
0 |
|
 Allen Craig
 |
Craig Allen |
RF |
$2,750,000 |
2750000 |
2.47% |
2.47 |
-1.34 |
-1.34346 |
— |
0 |
— |
0 |
|
 Ty Wigginton
 |
Wigginton Ty |
DNP |
$2,500,000 |
2500000 |
2.25% |
2.25 |
— |
0.00 |
— |
0 |
— |
0 |
|
 Daniel Descalso
 |
Descalso Daniel |
PH |
$1,290,000 |
1290000 |
1.16% |
1.16 |
0.05 |
0.0548926 |
0.04 |
0.042552403100775 |
$23,500,435 |
23500435.395664 |
|
 Matt Carpenter
 |
Carpenter Matt |
3B |
$1,250,000 |
1250000 |
1.12% |
1.12 |
3.59 |
3.58742 |
2.87 |
2.869936 |
$348,440 |
348439.82583584 |
|
 Peter Bourjos
 |
Bourjos Peter |
CF |
$1,200,000 |
1200000 |
1.08% |
1.08 |
0.86 |
0.855779 |
0.71 |
0.71314916666667 |
$1,402,231 |
1402231.1835182 |
|
 Pat Neshek
 |
Neshek Pat |
RP |
$1,000,000 |
1000000 |
0.90% |
0.90 |
0.74 |
0.737906 |
0.74 |
0.737906 |
$1,355,186 |
1355186.1619231 |
|
 Aledmys Díaz
 |
Diaz Aledmys |
DNP |
$1,000,000 |
1000000 |
0.90% |
0.90 |
— |
0.00 |
— |
0 |
— |
0 |
|
 Lance Lynn
 |
Lynn Lance |
RP |
$535,000 |
535000 |
0.48% |
0.48 |
1.65 |
1.65417 |
3.09 |
3.0919065420561 |
$323,425 |
323425.0409571 |
|
 Joe Kelly
 |
Kelly Joe |
RP |
$523,000 |
523000 |
0.47% |
0.47 |
0.12 |
0.122449 |
0.23 |
0.23412810707457 |
$4,271,166 |
4271165.9548057 |
|
 Tony Cruz
 |
Cruz Tony |
C |
$521,000 |
521000 |
0.47% |
0.47 |
-1.23 |
-1.23106 |
— |
0 |
— |
0 |
|
 Trevor Rosenthal
 |
Rosenthal Trevor |
RP |
$521,000 |
521000 |
0.47% |
0.47 |
0.14 |
0.1397 |
0.27 |
0.26813819577735 |
$3,729,420 |
3729420.1861131 |
|
 Shelby Miller
 |
Miller Shelby |
RP |
$521,000 |
521000 |
0.47% |
0.47 |
-0.95 |
-0.947739 |
— |
0 |
— |
0 |
|
 Shane Robinson
 |
Robinson Shane |
PH |
$519,000 |
519000 |
0.47% |
0.47 |
-0.39 |
-0.392369 |
— |
0 |
— |
0 |
|
 Matt Adams
 |
Adams Matt |
1B |
$516,000 |
516000 |
0.46% |
0.46 |
1.11 |
1.10848 |
2.15 |
2.1482170542636 |
$465,502 |
465502.30946882 |
|
 Michael Wacha
 |
Wacha Michael |
RP |
$510,000 |
510000 |
0.46% |
0.46 |
1.45 |
1.44904 |
2.84 |
2.8412549019608 |
$351,957 |
351957.15784243 |
|
 Seth Maness
 |
Maness Seth |
RP |
$509,000 |
509000 |
0.46% |
0.46 |
1.31 |
1.30728 |
2.57 |
2.5683300589391 |
$389,358 |
389358.0564225 |
|
 Carlos Martínez
 |
Martinez Carlos |
RP |
$505,000 |
505000 |
0.45% |
0.45 |
1.53 |
1.53145 |
3.03 |
3.0325742574257 |
$329,753 |
329752.84860753 |
|
 Kevin Siegrist
 |
Siegrist Kevin |
RP |
$505,000 |
505000 |
0.45% |
0.45 |
-0.42 |
-0.422045 |
— |
0 |
— |
0 |
|
 Kolten Wong
 |
Wong Kolten |
2B |
$500,000 |
500000 |
0.45% |
0.45 |
0.52 |
0.523229 |
1.05 |
1.046458 |
$955,605 |
955604.52497855 |
|
| Year | Cardinals payroll |
PR Sort |
Avg payroll |
AvgPR Sort |
Diff |
Diff Sort |
|---|
| 1977 | $60,000 | 60000 | $60,000 | 60000 | $0 | 0 |
| 1979 | $75,000 | 75000 | $48,000 | 48000 | $27,000 | 27000 |
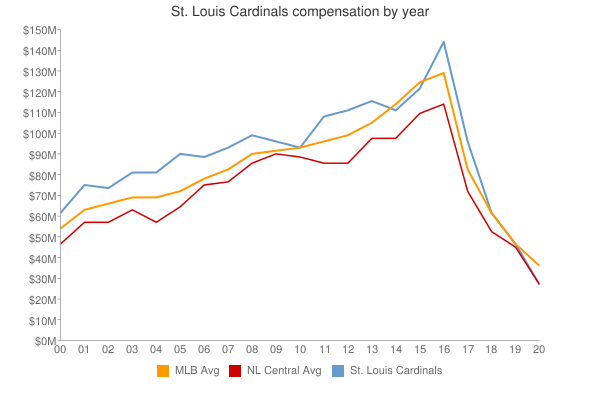
| 2000 | $62,093,023 | 62093023 | $57,491,092 | 57491092 | $4,601,931 | 4601931 |
| 2001 | $76,903,333 | 76903333 | $67,120,750 | 67120750 | $9,782,583 | 9782583 |
| 2002 | $74,425,875 | 74425875 | $69,204,705 | 69204705 | $5,221,170 | 5221170 |
| 2003 | $81,365,000 | 81365000 | $72,156,639 | 72156639 | $9,208,361 | 9208361 |
| 2004 | $81,895,000 | 81895000 | $71,426,357 | 71426357 | $10,468,643 | 10468643 |
| 2005 | $90,948,500 | 90948500 | $73,628,169 | 73628169 | $17,320,331 | 17320331 |
| 2006 | $89,093,658 | 89093658 | $81,192,832 | 81192832 | $7,900,826 | 7900826 |
| 2007 | $94,366,000 | 94366000 | $85,747,487 | 85747487 | $8,618,513 | 8618513 |
| 2008 | $99,865,500 | 99865500 | $93,079,041 | 93079041 | $6,786,459 | 6786459 |
| 2009 | $96,298,500 | 96298500 | $92,957,049 | 92957049 | $3,341,451 | 3341451 |
| 2010 | $94,220,500 | 94220500 | $94,957,956 | 94957956 | $-737,456 | -737456 |
| 2011 | $109,098,000 | 109098000 | $97,426,414 | 97426414 | $11,671,586 | 11671586 |
| 2012 | $111,858,500 | 111858500 | $100,689,500 | 100689500 | $11,169,000 | 11169000 |
| 2013 | $116,505,000 | 116505000 | $106,658,387 | 106658387 | $9,846,613 | 9846613 |
| 2014 | $111,250,000 | 111250000 | $115,428,670 | 115428670 | $-4,178,670 | -4178670 |
| 2015 | $122,066,500 | 122066500 | $125,458,486 | 125458486 | $-3,391,986 | -3391986 |
| 2016 | $145,553,500 | 145553500 | $130,290,910 | 130290910 | $15,262,590 | 15262590 |
| 2017 | $150,152,933 | 150152933 | $136,573,000 | 136573000 | $13,579,933 | 13579933 |
| 2018 | $159,698,667 | 159698667 | $135,681,867 | 135681867 | $24,016,800 | 24016800 |
| 2019 | $162,620,267 | 162620267 | $134,776,225 | 134776225 | $27,844,042 | 27844042 |
| 2020 | $166,101,500 | 166101500 | $138,321,485 | 138321485 | $27,780,015 | 27780015 |
| 2021 | $156,459,167 | 156459167 | $129,635,938 | 129635938 | $26,823,229 | 26823229 |
| 2022 | $140,285,316 | 140285316 | $147,002,411 | 147002411 | $-6,717,095 | -6717095 |
| 2023 | $180,440,183 | 180440183 | $158,155,877 | 158155877 | $22,284,306 | 22284306 |
| 2024 | $155,916,667 | 155916667 | $133,074,721 | 133074721 | $22,841,946 | 22841946 |
| 2025 | $113,906,667 | 113906667 | $94,180,059 | 94180059 | $19,726,608 | 19726608 |
| 2026 | $75,000,000 | 75000000 | $74,818,461 | 74818461 | $181,539 | 181539 |
| 2027 | $38,500,000 | 38500000 | $56,972,319 | 56972319 | $-18,472,319 | -18472319 |
| 2028 | $5,000,000 | 5000000 | $45,437,759 | 45437759 | $-40,437,759 | -40437759 |
|
 2014 St. Louis Cardinals