| Player | Player Sort | Pos | Salary | Salary Sort | Pct | Pct Sort | WARP | WARP Sort | WARP/$M | WARP/$M Sort | $/WARP | $/WARP Sort | Current Status |
|---|
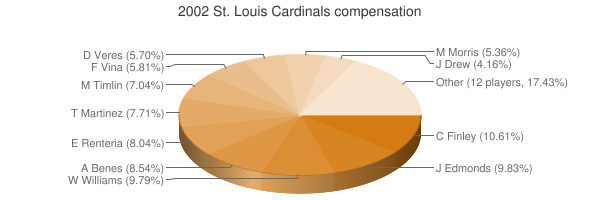
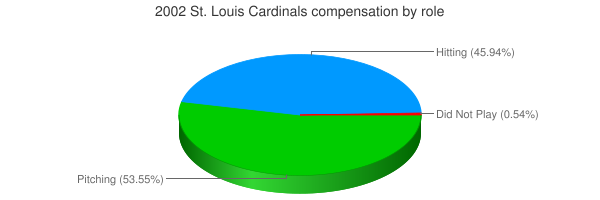
 Jim Edmonds
 |
Edmonds Jim |
CF |
$7,333,333 |
7333333 |
9.85% |
9.85 |
6.56 |
6.56083 |
0.89 |
0.89465867702994 |
$1,117,745 |
1117744.7060814 |
|
 Woody Williams
 |
Williams Woody |
RP |
$7,300,000 |
7300000 |
9.81% |
9.81 |
3.42 |
3.41732 |
0.47 |
0.46812602739726 |
$2,136,177 |
2136176.8871513 |
|
 Darryl Kile
 |
Kile Darryl |
RP |
$7,166,667 |
7166667 |
9.63% |
9.63 |
1.22 |
1.21815 |
0.17 |
0.16997441069886 |
$5,883,239 |
5883238.517424 |
|
 Andy Benes
 |
Benes Andy |
RP |
$6,367,542 |
6367542 |
8.56% |
8.56 |
0.57 |
0.566358 |
0.09 |
0.088944525218679 |
$11,242,963 |
11242962.931573 |
|
 Edgar Renteria
 |
Renteria Edgar |
SS |
$6,000,000 |
6000000 |
8.06% |
8.06 |
3.95 |
3.94877 |
0.66 |
0.65812833333333 |
$1,519,460 |
1519460.4902286 |
|
 Tino Martinez
 |
Martinez Tino |
1B |
$5,750,000 |
5750000 |
7.73% |
7.73 |
1.22 |
1.22014 |
0.21 |
0.21219826086957 |
$4,712,574 |
4712573.9669218 |
|
 Mike Timlin
 |
Timlin Mike |
RP |
$5,250,000 |
5250000 |
7.05% |
7.05 |
1.25 |
1.2519 |
0.24 |
0.23845714285714 |
$4,193,626 |
4193625.6889528 |
|
 Fernando Vina
 |
Vina Fernando |
2B |
$4,333,333 |
4333333 |
5.82% |
5.82 |
0.12 |
0.124906 |
0.03 |
0.028824463755728 |
$34,692,753 |
34692752.950219 |
|
 Dave Veres
 |
Veres Dave |
RP |
$4,250,000 |
4250000 |
5.71% |
5.71 |
1.22 |
1.21925 |
0.29 |
0.28688235294118 |
$3,485,749 |
3485749.4361288 |
|
 Matt Morris
 |
Morris Matt |
RP |
$4,000,000 |
4000000 |
5.37% |
5.37 |
6.51 |
6.51196 |
1.63 |
1.62799 |
$614,254 |
614254.38731196 |
|
 J.D. Drew
 |
Drew J.D. |
RF |
$3,100,000 |
3100000 |
4.17% |
4.17 |
1.90 |
1.89722 |
0.61 |
0.6120064516129 |
$1,633,970 |
1633969.7030392 |
|
 Jason Isringhausen
 |
Isringhausen Jason |
RP |
$2,750,000 |
2750000 |
3.69% |
3.69 |
1.96 |
1.95924 |
0.71 |
0.71245090909091 |
$1,403,605 |
1403605.4796758 |
|
 Mike Matheny
 |
Matheny Mike |
C |
$2,500,000 |
2500000 |
3.36% |
3.36 |
1.81 |
1.81431 |
0.73 |
0.725724 |
$1,377,934 |
1377934.3111155 |
|
 Placido Polanco
 |
Polanco Placido |
3B |
$1,750,000 |
1750000 |
2.35% |
2.35 |
1.07 |
1.07123 |
0.61 |
0.61213142857143 |
$1,633,636 |
1633636.1005573 |
|
 Steve Kline
 |
Kline Steve |
RP |
$1,200,000 |
1200000 |
1.61% |
1.61 |
0.84 |
0.840892 |
0.70 |
0.70074333333333 |
$1,427,056 |
1427056.0309766 |
|
 Garrett Stephenson
 |
Stephenson Garrett |
RP |
$900,000 |
900000 |
1.21% |
1.21 |
0.62 |
0.617649 |
0.69 |
0.68627666666667 |
$1,457,138 |
1457138.2775654 |
|
 Eli Marrero
 |
Marrero Eli |
RF |
$850,000 |
850000 |
1.14% |
1.14 |
2.42 |
2.42336 |
2.85 |
2.8510117647059 |
$350,753 |
350752.67397333 |
|
 Mike DiFelice
 |
Difelice Mike |
C |
$750,000 |
750000 |
1.01% |
1.01 |
0.12 |
0.118427 |
0.16 |
0.15790266666667 |
$6,333,015 |
6333015.2752328 |
|
 Albert Pujols
 |
Pujols Albert |
LF |
$600,000 |
600000 |
0.81% |
0.81 |
5.35 |
5.34905 |
8.92 |
8.9150833333333 |
$112,169 |
112169.45065012 |
|
 Miguel Cairo
 |
Cairo Miguel |
PH |
$600,000 |
600000 |
0.81% |
0.81 |
-0.28 |
-0.275764 |
— |
0 |
— |
0 |
|
 Lance Painter
 |
Painter Lance |
DNP |
$575,000 |
575000 |
0.77% |
0.77 |
— |
0.00 |
— |
0 |
— |
0 |
|
 Eduardo Perez
 |
Perez Eduardo |
PH |
$450,000 |
450000 |
0.60% |
0.60 |
0.65 |
0.646264 |
1.44 |
1.4361422222222 |
$696,310 |
696309.86717502 |
|
 Rick Ankiel
 |
Ankiel Rick |
DNP |
$400,000 |
400000 |
0.54% |
0.54 |
— |
0.00 |
— |
0 |
— |
0 |
|
 Kerry Robinson
 |
Robinson Kerry |
PH |
$250,000 |
250000 |
0.34% |
0.34 |
-0.14 |
-0.13936 |
— |
0 |
— |
0 |
|
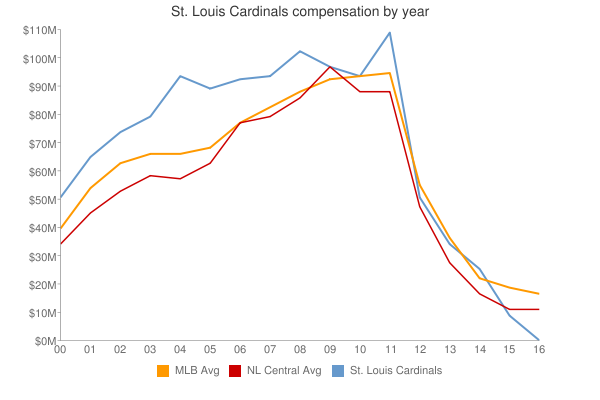
| Year | Cardinals payroll |
PR Sort |
Avg payroll |
AvgPR Sort |
Diff |
Diff Sort |
|---|
| 1977 | $60,000 | 60000 | $60,000 | 60000 | $0 | 0 |
| 1979 | $75,000 | 75000 | $48,000 | 48000 | $27,000 | 27000 |
| 2000 | $62,093,023 | 62093023 | $55,368,142 | 55368142 | $6,724,881 | 6724881 |
| 2001 | $76,903,333 | 76903333 | $64,937,084 | 64937084 | $11,966,249 | 11966249 |
| 2002 | $74,425,875 | 74425875 | $67,238,672 | 67238672 | $7,187,203 | 7187203 |
| 2003 | $81,365,000 | 81365000 | $70,654,480 | 70654480 | $10,710,520 | 10710520 |
| 2004 | $81,895,000 | 81895000 | $69,466,729 | 69466729 | $12,428,271 | 12428271 |
| 2005 | $90,948,500 | 90948500 | $74,114,841 | 74114841 | $16,833,659 | 16833659 |
| 2006 | $89,093,658 | 89093658 | $79,621,815 | 79621815 | $9,471,843 | 9471843 |
| 2007 | $94,366,000 | 94366000 | $85,537,470 | 85537470 | $8,828,530 | 8828530 |
| 2008 | $99,865,500 | 99865500 | $92,003,799 | 92003799 | $7,861,701 | 7861701 |
| 2009 | $96,298,500 | 96298500 | $92,169,598 | 92169598 | $4,128,902 | 4128902 |
| 2010 | $94,220,500 | 94220500 | $94,342,601 | 94342601 | $-122,101 | -122101 |
| 2011 | $109,098,000 | 109098000 | $96,974,710 | 96974710 | $12,123,290 | 12123290 |
| 2012 | $111,858,500 | 111858500 | $100,947,217 | 100947217 | $10,911,283 | 10911283 |
| 2013 | $116,505,000 | 116505000 | $108,586,966 | 108586966 | $7,918,034 | 7918034 |
| 2014 | $111,250,000 | 111250000 | $117,131,361 | 117131361 | $-5,881,361 | -5881361 |
| 2015 | $122,066,500 | 122066500 | $126,168,161 | 126168161 | $-4,101,661 | -4101661 |
| 2016 | $145,553,500 | 145553500 | $131,756,569 | 131756569 | $13,796,931 | 13796931 |
| 2017 | $150,152,933 | 150152933 | $136,337,445 | 136337445 | $13,815,488 | 13815488 |
| 2018 | $159,698,667 | 159698667 | $135,360,600 | 135360600 | $24,338,067 | 24338067 |
| 2019 | $162,620,267 | 162620267 | $134,792,134 | 134792134 | $27,828,133 | 27828133 |
| 2020 | $166,101,500 | 166101500 | $139,496,467 | 139496467 | $26,605,033 | 26605033 |
| 2021 | $156,459,167 | 156459167 | $130,712,288 | 130712288 | $25,746,879 | 25746879 |
| 2022 | $140,285,316 | 140285316 | $149,802,695 | 149802695 | $-9,517,379 | -9517379 |
| 2023 | $180,440,183 | 180440183 | $161,692,345 | 161692345 | $18,747,838 | 18747838 |
| 2024 | $155,916,667 | 155916667 | $136,306,249 | 136306249 | $19,610,418 | 19610418 |
| 2025 | $113,906,667 | 113906667 | $98,329,527 | 98329527 | $15,577,140 | 15577140 |
| 2026 | $75,000,000 | 75000000 | $78,039,273 | 78039273 | $-3,039,273 | -3039273 |
| 2027 | $38,500,000 | 38500000 | $60,919,343 | 60919343 | $-22,419,343 | -22419343 |
| 2028 | $5,000,000 | 5000000 | $46,901,712 | 46901712 | $-41,901,712 | -41901712 |
|
 2002 St. Louis Cardinals