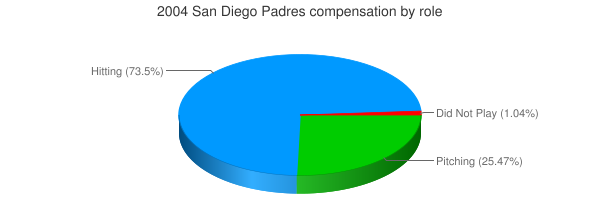
| Player | Player Sort | Pos | Salary | Salary Sort | Pct | Pct Sort | WARP | WARP Sort | WARP/$M | WARP/$M Sort | $/WARP | $/WARP Sort | Current Status |
|---|
 Brian Giles
 |
Giles Brian |
RF |
$8,833,333 |
8833333 |
14.93% |
14.93 |
4.39 |
4.38768 |
0.50 |
0.49671850931013 |
$2,013,213 |
2013212.6773147 |
|
 Phil Nevin
 |
Nevin Phil |
1B |
$8,500,000 |
8500000 |
14.36% |
14.36 |
3.82 |
3.81643 |
0.45 |
0.44899176470588 |
$2,227,212 |
2227212.3424247 |
|
 Jeff Cirillo
 |
Cirillo Jeff |
3B |
$6,725,000 |
6725000 |
11.37% |
11.37 |
-0.28 |
-0.280835 |
— |
0 |
— |
0 |
|
 Ryan Klesko
 |
Klesko Ryan |
LF |
$6,000,000 |
6000000 |
10.14% |
10.14 |
1.88 |
1.88445 |
0.31 |
0.314075 |
$3,183,953 |
3183952.8774974 |
|
 Terrence Long
 |
Long Terrence |
LF |
$3,700,000 |
3700000 |
6.25% |
6.25 |
0.58 |
0.576184 |
0.16 |
0.15572540540541 |
$6,421,560 |
6421559.7795149 |
|
 Ramon Hernandez
 |
Hernandez Ramon |
C |
$2,900,000 |
2900000 |
4.90% |
4.90 |
3.85 |
3.85255 |
1.33 |
1.3284655172414 |
$752,748 |
752748.17977703 |
|
 Mark Loretta
 |
Loretta Mark |
2B |
$2,500,000 |
2500000 |
4.22% |
4.22 |
7.29 |
7.28926 |
2.92 |
2.915704 |
$342,970 |
342970.34266853 |
|
 Trevor Hoffman
 |
Hoffman Trevor |
RP |
$2,500,000 |
2500000 |
4.22% |
4.22 |
1.62 |
1.6186 |
0.65 |
0.64744 |
$1,544,545 |
1544544.6682318 |
|
 Adam Eaton
 |
Eaton Adam |
RP |
$1,925,000 |
1925000 |
3.25% |
3.25 |
4.97 |
4.96949 |
2.58 |
2.5815532467532 |
$387,364 |
387363.69325625 |
|
 Jay Witasick
 |
Witasick Jay |
RP |
$1,750,000 |
1750000 |
2.96% |
2.96 |
1.42 |
1.42145 |
0.81 |
0.81225714285714 |
$1,231,137 |
1231137.2190369 |
|
 Rod Beck
 |
Beck Rod |
RP |
$1,750,000 |
1750000 |
2.96% |
2.96 |
-0.39 |
-0.385417 |
— |
0 |
— |
0 |
|
 Jay Payton
 |
Payton Jay |
CF |
$1,500,000 |
1500000 |
2.53% |
2.53 |
2.55 |
2.54835 |
1.70 |
1.6989 |
$588,616 |
588616.16339985 |
|
 David Wells
 |
Wells David |
RP |
$1,250,000 |
1250000 |
2.11% |
2.11 |
5.02 |
5.01626 |
4.01 |
4.013008 |
$249,190 |
249189.63530598 |
|
 Brian Lawrence
 |
Lawrence Brian |
RP |
$925,000 |
925000 |
1.56% |
1.56 |
4.09 |
4.09233 |
4.42 |
4.4241405405405 |
$226,033 |
226032.60245386 |
|
 Ismael Valdez
 |
Valdez Ismael |
RP |
$800,000 |
800000 |
1.35% |
1.35 |
-0.78 |
-0.780655 |
— |
0 |
— |
0 |
|
 Robert Fick
 |
Fick Robert |
PH |
$800,000 |
800000 |
1.35% |
1.35 |
-0.01 |
-0.0124206 |
— |
0 |
— |
0 |
|
 Sterling Hitchcock
 |
Hitchcock Sterling |
RP |
$800,000 |
800000 |
1.35% |
1.35 |
-0.02 |
-0.0178813 |
— |
0 |
— |
0 |
|
 Antonio Osuna
 |
Osuna Antonio |
RP |
$750,000 |
750000 |
1.27% |
1.27 |
0.90 |
0.898189 |
1.20 |
1.1975853333333 |
$835,014 |
835013.56618707 |
|
 Akinori Otsuka
 |
Otsuka Akinori |
RP |
$700,000 |
700000 |
1.18% |
1.18 |
2.57 |
2.5703 |
3.67 |
3.6718571428571 |
$272,342 |
272341.74999027 |
|
 Brian Buchanan
 |
Buchanan Brian |
PH |
$650,000 |
650000 |
1.10% |
1.10 |
-0.43 |
-0.428619 |
— |
0 |
— |
0 |
|
 Eddie Oropesa
 |
Oropesa Eddie |
RP |
$600,000 |
600000 |
1.01% |
1.01 |
-0.10 |
-0.099988 |
— |
0 |
— |
0 |
|
 Kerry Robinson
 |
Robinson Kerry |
LF |
$450,000 |
450000 |
0.76% |
0.76 |
0.26 |
0.260276 |
0.58 |
0.57839111111111 |
$1,728,934 |
1728933.9009359 |
|
 Jake Peavy
 |
Peavy Jake |
RP |
$350,000 |
350000 |
0.59% |
0.59 |
6.27 |
6.2672 |
17.91 |
17.906285714286 |
$55,846 |
55846.310952259 |
|
 Ramón Vázquez
 |
Vazquez Ramon |
SS |
$342,500 |
342500 |
0.58% |
0.58 |
-0.22 |
-0.217896 |
— |
0 |
— |
0 |
|
 Sean Burroughs
 |
Burroughs Sean |
3B |
$340,000 |
340000 |
0.57% |
0.57 |
1.34 |
1.34293 |
3.95 |
3.9497941176471 |
$253,178 |
253177.75312191 |
|
 Scott Linebrink
 |
Linebrink Scott |
RP |
$326,000 |
326000 |
0.55% |
0.55 |
2.21 |
2.20953 |
6.78 |
6.7776993865031 |
$147,543 |
147542.69007436 |
|
 Miguel Ojeda
 |
Ojeda Miguel |
C |
$305,000 |
305000 |
0.52% |
0.52 |
1.40 |
1.39857 |
4.59 |
4.5854754098361 |
$218,080 |
218079.89589366 |
|
 Khalil Greene
 |
Greene Khalil |
SS |
$300,500 |
300500 |
0.51% |
0.51 |
3.79 |
3.79343 |
12.62 |
12.623727121464 |
$79,216 |
79215.907503236 |
|
 Chris Snelling
 |
Snelling Chris |
DNP |
$300,000 |
300000 |
0.51% |
0.51 |
— |
0.00 |
— |
0 |
— |
0 |
|
 Jason Szuminski
 |
Szuminski Jason |
RP |
$300,000 |
300000 |
0.51% |
0.51 |
-0.03 |
-0.0336466 |
— |
0 |
— |
0 |
|
 Eric Junge
 |
Junge Eric |
DNP |
$300,000 |
300000 |
0.51% |
0.51 |
— |
0.00 |
— |
0 |
— |
0 |
|
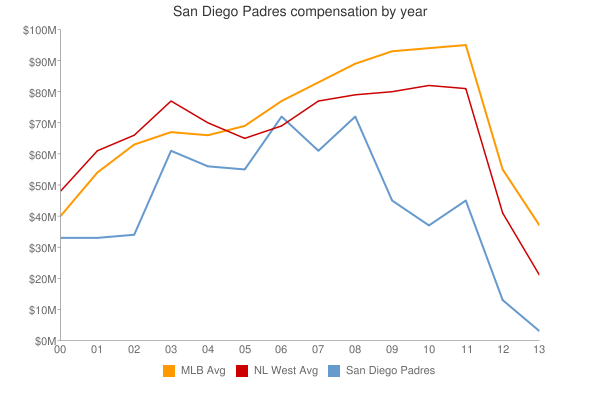
| Year | Padres payroll |
PR Sort |
Avg payroll |
AvgPR Sort |
Diff |
Diff Sort |
|---|
| 1996 | $2,000,000 | 2000000 | $4,109,148 | 4109148 | $-2,109,148 | -2109148 |
| 1997 | $2,000,000 | 2000000 | $4,753,000 | 4753000 | $-2,753,000 | -2753000 |
| 2000 | $53,816,000 | 53816000 | $55,368,142 | 55368142 | $-1,552,142 | -1552142 |
| 2001 | $37,438,000 | 37438000 | $64,937,084 | 64937084 | $-27,499,084 | -27499084 |
| 2002 | $40,678,000 | 40678000 | $67,238,672 | 67238672 | $-26,560,672 | -26560672 |
| 2003 | $43,565,000 | 43565000 | $70,654,480 | 70654480 | $-27,089,480 | -27089480 |
| 2004 | $59,172,333 | 59172333 | $69,466,729 | 69466729 | $-10,294,396 | -10294396 |
| 2005 | $62,186,333 | 62186333 | $74,114,841 | 74114841 | $-11,928,508 | -11928508 |
| 2006 | $69,170,167 | 69170167 | $79,621,815 | 79621815 | $-10,451,648 | -10451648 |
| 2007 | $58,571,067 | 58571067 | $85,537,470 | 85537470 | $-26,966,403 | -26966403 |
| 2008 | $74,010,117 | 74010117 | $92,003,799 | 92003799 | $-17,993,682 | -17993682 |
| 2009 | $44,173,200 | 44173200 | $92,169,598 | 92169598 | $-47,996,398 | -47996398 |
| 2010 | $37,799,300 | 37799300 | $94,342,601 | 94342601 | $-56,543,301 | -56543301 |
| 2011 | $45,869,140 | 45869140 | $96,974,710 | 96974710 | $-51,105,570 | -51105570 |
| 2012 | $55,621,900 | 55621900 | $100,947,217 | 100947217 | $-45,325,317 | -45325317 |
| 2013 | $68,333,600 | 68333600 | $108,586,966 | 108586966 | $-40,253,366 | -40253366 |
| 2014 | $90,636,600 | 90636600 | $117,131,361 | 117131361 | $-26,494,761 | -26494761 |
| 2015 | $108,387,033 | 108387033 | $126,168,161 | 126168161 | $-17,781,128 | -17781128 |
| 2016 | $100,509,500 | 100509500 | $131,756,569 | 131756569 | $-31,247,069 | -31247069 |
| 2017 | $67,624,400 | 67624400 | $136,337,445 | 136337445 | $-68,713,045 | -68713045 |
| 2018 | $94,037,733 | 94037733 | $135,360,600 | 135360600 | $-41,322,867 | -41322867 |
| 2019 | $100,804,100 | 100804100 | $134,792,134 | 134792134 | $-33,988,034 | -33988034 |
| 2020 | $151,461,550 | 151461550 | $139,496,467 | 139496467 | $11,965,083 | 11965083 |
| 2021 | $171,488,220 | 171488220 | $130,712,288 | 130712288 | $40,775,932 | 40775932 |
| 2022 | $212,846,719 | 212846719 | $149,802,695 | 149802695 | $63,044,024 | 63044024 |
| 2023 | $221,599,740 | 221599740 | $161,692,345 | 161692345 | $59,907,395 | 59907395 |
| 2024 | $153,892,054 | 153892054 | $136,306,249 | 136306249 | $17,585,805 | 17585805 |
| 2025 | $150,295,454 | 150295454 | $98,329,527 | 98329527 | $51,965,927 | 51965927 |
| 2026 | $137,745,454 | 137745454 | $78,039,273 | 78039273 | $59,706,181 | 59706181 |
| 2027 | $156,495,454 | 156495454 | $60,919,343 | 60919343 | $95,576,111 | 95576111 |
| 2028 | $124,545,454 | 124545454 | $46,901,712 | 46901712 | $77,643,742 | 77643742 |
| 2029 | $113,545,454 | 113545454 | $38,597,944 | 38597944 | $74,947,510 | 74947510 |
| 2030 | $113,545,454 | 113545454 | $41,447,579 | 41447579 | $72,097,875 | 72097875 |
| 2031 | $101,259,739 | 101259739 | $38,360,152 | 38360152 | $62,899,587 | 62899587 |
| 2032 | $101,259,739 | 101259739 | $47,925,459 | 47925459 | $53,334,280 | 53334280 |
| 2033 | $101,259,739 | 101259739 | $43,068,924 | 43068924 | $58,190,815 | 58190815 |
| 2034 | $36,714,285 | 36714285 | $29,428,571 | 29428571 | $7,285,714 | 7285714 |
|
 2004 San Diego Padres