| Player | Player Sort | Pos | Salary | Salary Sort | Pct | Pct Sort | WARP | WARP Sort | WARP/$M | WARP/$M Sort | $/WARP | $/WARP Sort | Current Status |
|---|
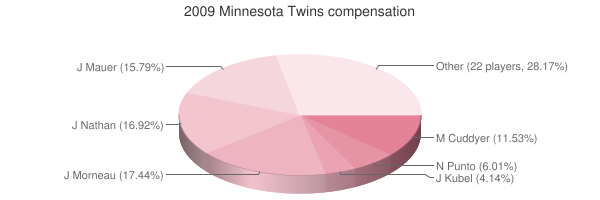
 Justin Morneau
 |
Morneau Justin |
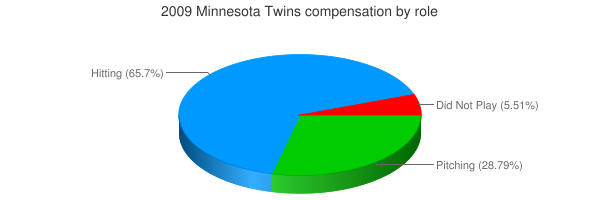
1B |
$11,600,000 |
11600000 |
17.31% |
17.31 |
2.79 |
2.78784 |
0.24 |
0.24033103448276 |
$4,160,927 |
4160927.456382 |
|
 Joe Nathan
 |
Nathan Joe |
RP |
$11,250,000 |
11250000 |
16.78% |
16.78 |
2.28 |
2.27994 |
0.20 |
0.20266133333333 |
$4,934,340 |
4934340.3773784 |
|
 Joe Mauer
 |
Mauer Joe |
C |
$10,500,000 |
10500000 |
15.67% |
15.67 |
8.13 |
8.13155 |
0.77 |
0.77443333333333 |
$1,291,267 |
1291266.7326647 |
|
 Michael Cuddyer
 |
Cuddyer Michael |
RF |
$7,666,667 |
7666667 |
11.44% |
11.44 |
0.68 |
0.676876 |
0.09 |
0.088288170074427 |
$11,326,546 |
11326545.777956 |
|
 Nick Punto
 |
Punto Nick |
2B |
$4,000,000 |
4000000 |
5.97% |
5.97 |
0.19 |
0.190314 |
0.05 |
0.0475785 |
$21,017,897 |
21017896.739073 |
|
 Jason Kubel
 |
Kubel Jason |
DH |
$2,750,000 |
2750000 |
4.10% |
4.10 |
3.26 |
3.26102 |
1.19 |
1.1858254545455 |
$843,294 |
843294.42935033 |
|
 Mike Lamb
 |
Lamb Mike |
DNP |
$2,600,000 |
2600000 |
3.88% |
3.88 |
— |
0.00 |
— |
0 |
— |
0 |
|
 Joe Crede
 |
Crede Joe |
3B |
$2,500,000 |
2500000 |
3.73% |
3.73 |
1.22 |
1.21825 |
0.49 |
0.4873 |
$2,052,124 |
2052123.9482865 |
|
 Jesse Crain
 |
Crain Jesse |
RP |
$1,700,000 |
1700000 |
2.54% |
2.54 |
0.45 |
0.445523 |
0.26 |
0.26207235294118 |
$3,815,740 |
3815740.1525847 |
|
 Matt Guerrier
 |
Guerrier Matt |
RP |
$1,475,000 |
1475000 |
2.20% |
2.20 |
1.42 |
1.42319 |
0.96 |
0.96487457627119 |
$1,036,404 |
1036404.1343742 |
|
 Luis Ayala
 |
Ayala Luis |
RP |
$1,300,000 |
1300000 |
1.94% |
1.94 |
-0.48 |
-0.478339 |
— |
0 |
— |
0 |
|
 Delmon Young
 |
Young Delmon |
LF |
$1,152,000 |
1152000 |
1.72% |
1.72 |
-0.49 |
-0.487835 |
— |
0 |
— |
0 |
|
 Philip Humber
 |
Humber Philip |
RP |
$1,150,000 |
1150000 |
1.72% |
1.72 |
0.03 |
0.0253541 |
0.02 |
0.022047043478261 |
$45,357,556 |
45357555.582726 |
|
 Mike Redmond
 |
Redmond Mike |
C |
$950,000 |
950000 |
1.42% |
1.42 |
-0.47 |
-0.465787 |
— |
0 |
— |
0 |
|
 Scott Baker
 |
Baker Scott |
RP |
$750,000 |
750000 |
1.12% |
1.12 |
2.57 |
2.57443 |
3.43 |
3.4325733333333 |
$291,327 |
291326.62375749 |
|
 R.A. Dickey
 |
Dickey R.A. |
RP |
$525,000 |
525000 |
0.78% |
0.78 |
-0.09 |
-0.0908444 |
— |
0 |
— |
0 |
|
 Brendan Harris
 |
Harris Brendan |
SS |
$466,100 |
466100 |
0.70% |
0.70 |
1.04 |
1.04372 |
2.24 |
2.2392619609526 |
$446,576 |
446575.70996053 |
|
 Nick Blackburn
 |
Blackburn Nick |
RP |
$440,000 |
440000 |
0.66% |
0.66 |
0.59 |
0.586901 |
1.33 |
1.3338659090909 |
$749,701 |
749700.54574792 |
|
 Kevin Slowey
 |
Slowey Kevin |
RP |
$440,000 |
440000 |
0.66% |
0.66 |
0.31 |
0.305546 |
0.69 |
0.69442272727273 |
$1,440,045 |
1440045.0341356 |
|
 Pat Neshek
 |
Neshek Pat |
DNP |
$440,000 |
440000 |
0.66% |
0.66 |
— |
0.00 |
— |
0 |
— |
0 |
|
 Carlos Gómez
 |
Gomez Carlos |
CF |
$437,500 |
437500 |
0.65% |
0.65 |
0.56 |
0.559736 |
1.28 |
1.2793965714286 |
$781,618 |
781618.47728215 |
|
 Denard Span
 |
Span Denard |
CF |
$435,000 |
435000 |
0.65% |
0.65 |
3.26 |
3.26247 |
7.50 |
7.4999310344828 |
$133,335 |
133334.55939825 |
|
 Francisco Liriano
 |
Liriano Francisco |
RP |
$430,000 |
430000 |
0.64% |
0.64 |
-1.82 |
-1.81599 |
— |
0 |
— |
0 |
|
 Glen Perkins
 |
Perkins Glen |
RP |
$430,000 |
430000 |
0.64% |
0.64 |
0.14 |
0.135562 |
0.32 |
0.31526046511628 |
$3,171,980 |
3171980.3484752 |
|
 Alexi Casilla
 |
Casilla Alexi |
2B |
$427,500 |
427500 |
0.64% |
0.64 |
-1.43 |
-1.43457 |
— |
0 |
— |
0 |
|
 Brian Buscher
 |
Buscher Brian |
3B |
$412,500 |
412500 |
0.62% |
0.62 |
-0.22 |
-0.21851 |
— |
0 |
— |
0 |
Arb1/2011, Arb2/2012, Arb3/2013 |
 Jose Morales
 |
Morales Jose |
C |
$400,000 |
400000 |
0.60% |
0.60 |
0.18 |
0.175821 |
0.44 |
0.4395525 |
$2,275,041 |
2275041.0929297 |
|
 Brian Duensing
 |
Duensing Brian |
RP |
$400,000 |
400000 |
0.60% |
0.60 |
0.12 |
0.123224 |
0.31 |
0.30806 |
$3,246,121 |
3246120.8855418 |
|
| Year | Twins payroll |
PR Sort |
Avg payroll |
AvgPR Sort |
Diff |
Diff Sort |
|---|
| 1984 | $50,000 | 50000 | $260,000 | 260000 | $-210,000 | -210000 |
| 1985 | $130,000 | 130000 | $437,500 | 437500 | $-307,500 | -307500 |
| 1986 | $265,000 | 265000 | $552,000 | 552000 | $-287,000 | -287000 |
| 1987 | $465,000 | 465000 | $589,500 | 589500 | $-124,500 | -124500 |
| 1988 | $1,210,000 | 1210000 | $732,083 | 732083 | $477,917 | 477917 |
| 1989 | $2,050,000 | 2050000 | $862,714 | 862714 | $1,187,286 | 1187286 |
| 1990 | $2,700,000 | 2700000 | $1,203,571 | 1203571 | $1,496,429 | 1496429 |
| 1991 | $3,000,000 | 3000000 | $1,884,642 | 1884642 | $1,115,358 | 1115358 |
| 1992 | $3,300,000 | 3300000 | $2,356,071 | 2356071 | $943,929 | 943929 |
| 1993 | $5,200,000 | 5200000 | $3,410,000 | 3410000 | $1,790,000 | 1790000 |
| 1994 | $5,200,000 | 5200000 | $3,911,904 | 3911904 | $1,288,096 | 1288096 |
| 1995 | $6,200,000 | 6200000 | $5,208,333 | 5208333 | $991,667 | 991667 |
| 1996 | $6,200,000 | 6200000 | $4,583,416 | 4583416 | $1,616,584 | 1616584 |
| 1997 | $7,200,000 | 7200000 | $4,892,222 | 4892222 | $2,307,778 | 2307778 |
| 2000 | $16,542,500 | 16542500 | $56,164,089 | 56164089 | $-39,621,589 | -39621589 |
| 2001 | $23,930,000 | 23930000 | $65,991,638 | 65991638 | $-42,061,638 | -42061638 |
| 2002 | $39,950,000 | 39950000 | $68,244,471 | 68244471 | $-28,294,471 | -28294471 |
| 2003 | $55,275,000 | 55275000 | $71,318,479 | 71318479 | $-16,043,479 | -16043479 |
| 2004 | $53,815,000 | 53815000 | $70,466,961 | 70466961 | $-16,651,961 | -16651961 |
| 2005 | $56,556,000 | 56556000 | $73,264,780 | 73264780 | $-16,708,780 | -16708780 |
| 2006 | $65,024,500 | 65024500 | $79,051,754 | 79051754 | $-14,027,254 | -14027254 |
| 2007 | $72,189,500 | 72189500 | $83,931,138 | 83931138 | $-11,741,638 | -11741638 |
| 2008 | $61,442,667 | 61442667 | $90,812,373 | 90812373 | $-29,369,706 | -29369706 |
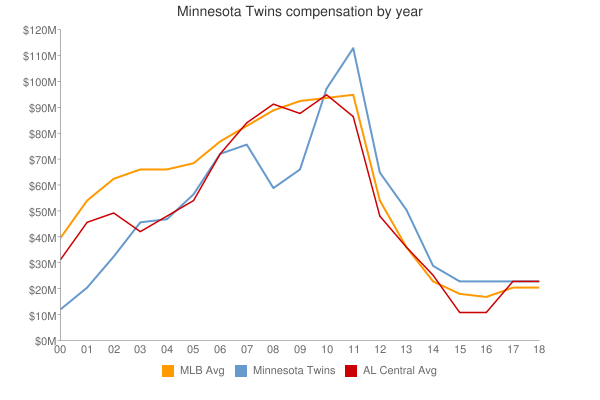
| 2009 | $67,027,267 | 67027267 | $91,093,211 | 91093211 | $-24,065,944 | -24065944 |
| 2010 | $98,159,167 | 98159167 | $93,373,681 | 93373681 | $4,785,486 | 4785486 |
| 2011 | $113,237,000 | 113237000 | $96,102,034 | 96102034 | $17,134,966 | 17134966 |
| 2012 | $100,431,000 | 100431000 | $100,657,138 | 100657138 | $-226,138 | -226138 |
| 2013 | $82,010,000 | 82010000 | $109,024,990 | 109024990 | $-27,014,990 | -27014990 |
| 2014 | $92,874,836 | 92874836 | $117,828,782 | 117828782 | $-24,953,946 | -24953946 |
| 2015 | $108,262,500 | 108262500 | $127,404,244 | 127404244 | $-19,141,744 | -19141744 |
| 2016 | $105,333,700 | 105333700 | $132,219,407 | 132219407 | $-26,885,707 | -26885707 |
| 2017 | $108,102,500 | 108102500 | $137,302,894 | 137302894 | $-29,200,394 | -29200394 |
| 2018 | $128,713,226 | 128713226 | $136,929,168 | 136929168 | $-8,215,942 | -8215942 |
| 2019 | $119,651,933 | 119651933 | $136,944,257 | 136944257 | $-17,292,324 | -17292324 |
| 2020 | $131,799,311 | 131799311 | $140,677,788 | 140677788 | $-8,878,477 | -8878477 |
| 2021 | $131,678,167 | 131678167 | $132,162,631 | 132162631 | $-484,464 | -484464 |
| 2022 | $141,020,356 | 141020356 | $149,374,046 | 149374046 | $-8,353,690 | -8353690 |
| 2023 | $154,063,740 | 154063740 | $160,460,390 | 160460390 | $-6,396,650 | -6396650 |
| 2024 | $108,346,590 | 108346590 | $135,504,022 | 135504022 | $-27,157,432 | -27157432 |
| 2025 | $96,981,190 | 96981190 | $96,417,302 | 96417302 | $563,888 | 563888 |
| 2026 | $70,726,190 | 70726190 | $76,694,120 | 76694120 | $-5,967,930 | -5967930 |
| 2027 | $68,726,190 | 68726190 | $58,935,617 | 58935617 | $9,790,573 | 9790573 |
| 2028 | $46,476,190 | 46476190 | $45,437,759 | 45437759 | $1,038,431 | 1038431 |
|
 2009 Minnesota Twins