| Player | Player Sort | Pos | Salary | Salary Sort | Pct | Pct Sort | WARP | WARP Sort | WARP/$M | WARP/$M Sort | $/WARP | $/WARP Sort | Current Status |
|---|
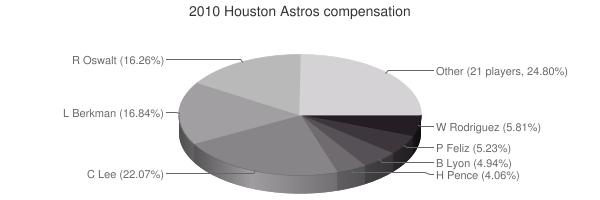
 Carlos Lee
 |
Lee Carlos |
LF |
$19,000,000 |
19000000 |
20.74% |
20.74 |
-1.40 |
-1.40034 |
— |
0 |
— |
0 |
|
 Lance Berkman
 |
Berkman Lance |
1B |
$14,500,000 |
14500000 |
15.83% |
15.83 |
1.89 |
1.8912 |
0.13 |
0.1304275862069 |
$7,667,090 |
7667089.678511 |
|
 Roy Oswalt
 |
Oswalt Roy |
RP |
$14,000,000 |
14000000 |
15.28% |
15.28 |
3.64 |
3.64449 |
0.26 |
0.26032071428571 |
$3,841,415 |
3841415.3969417 |
|
 Kazuo Matsui
 |
Matsui Kazuo |
2B |
$5,500,000 |
5500000 |
6.00% |
6.00 |
-0.92 |
-0.921464 |
— |
0 |
— |
0 |
|
 Wandy Rodriguez
 |
Rodriguez Wandy |
RP |
$5,000,000 |
5000000 |
5.46% |
5.46 |
4.21 |
4.2097 |
0.84 |
0.84194 |
$1,187,733 |
1187733.0926194 |
|
 Pedro Feliz
 |
Feliz Pedro |
3B |
$4,500,000 |
4500000 |
4.91% |
4.91 |
-1.06 |
-1.06064 |
— |
0 |
— |
0 |
|
 Brandon Lyon
 |
Lyon Brandon |
RP |
$4,250,000 |
4250000 |
4.64% |
4.64 |
0.58 |
0.577781 |
0.14 |
0.13594847058824 |
$7,355,728 |
7355728.2084388 |
|
 Hunter Pence
 |
Pence Hunter |
RF |
$3,500,000 |
3500000 |
3.82% |
3.82 |
4.99 |
4.99209 |
1.43 |
1.4263114285714 |
$701,109 |
701109.15468271 |
|
 Brett Myers
 |
Myers Brett |
RP |
$3,100,000 |
3100000 |
3.38% |
3.38 |
5.17 |
5.17137 |
1.67 |
1.6681838709677 |
$599,454 |
599454.30321172 |
|
 Brian Moehler
 |
Moehler Brian |
RP |
$3,000,000 |
3000000 |
3.27% |
3.27 |
-0.66 |
-0.664221 |
— |
0 |
— |
0 |
|
 Michael Bourn
 |
Bourn Michael |
CF |
$2,400,000 |
2400000 |
2.62% |
2.62 |
4.06 |
4.06166 |
1.69 |
1.6923583333333 |
$590,891 |
590891.40893132 |
|
 Matt Lindstrom
 |
Lindstrom Matt |
RP |
$1,625,000 |
1625000 |
1.77% |
1.77 |
0.04 |
0.0403099 |
0.02 |
0.024806092307692 |
$40,312,678 |
40312677.53083 |
|
 Tim Byrdak
 |
Byrdak Tim |
RP |
$1,600,000 |
1600000 |
1.75% |
1.75 |
-0.49 |
-0.492987 |
— |
0 |
— |
0 |
|
 Geoff Blum
 |
Blum Geoff |
PH |
$1,500,000 |
1500000 |
1.64% |
1.64 |
0.42 |
0.417868 |
0.28 |
0.27857866666667 |
$3,589,650 |
3589650.3201968 |
|
 Jeff Keppinger
 |
Keppinger Jeff |
2B |
$1,150,000 |
1150000 |
1.26% |
1.26 |
3.33 |
3.3321 |
2.90 |
2.8974782608696 |
$345,128 |
345127.69724798 |
|
 Chris Sampson
 |
Sampson Chris |
RP |
$815,000 |
815000 |
0.89% |
0.89 |
0.21 |
0.205754 |
0.25 |
0.25245889570552 |
$3,961,041 |
3961040.8546128 |
Arb2/2011, Arb3/2012, FA/2013 |
 Jason Michaels
 |
Michaels Jason |
PH |
$800,000 |
800000 |
0.87% |
0.87 |
0.40 |
0.404903 |
0.51 |
0.50612875 |
$1,975,782 |
1975781.8539255 |
|
 Humberto Quintero
 |
Quintero Humberto |
C |
$750,000 |
750000 |
0.82% |
0.82 |
0.53 |
0.533068 |
0.71 |
0.71075733333333 |
$1,406,950 |
1406949.9576039 |
|
 Cory Sullivan
 |
Sullivan Cory |
PH |
$700,000 |
700000 |
0.76% |
0.76 |
-0.40 |
-0.397497 |
— |
0 |
— |
0 |
|
 Jeff Fulchino
 |
Fulchino Jeff |
RP |
$425,000 |
425000 |
0.46% |
0.46 |
-0.20 |
-0.203649 |
— |
0 |
— |
0 |
|
 Alberto Arias
 |
Arias Alberto |
DNP |
$415,500 |
415500 |
0.45% |
0.45 |
— |
0.00 |
— |
0 |
— |
0 |
|
 Felipe Paulino
 |
Paulino Felipe |
RP |
$415,000 |
415000 |
0.45% |
0.45 |
0.67 |
0.665554 |
1.60 |
1.6037445783133 |
$623,541 |
623540.68941063 |
|
 J.R. Towles
 |
Towles J.R. |
C |
$406,500 |
406500 |
0.44% |
0.44 |
-0.02 |
-0.019344 |
— |
0 |
— |
0 |
|
 Sammy Gervacio
 |
Gervacio Sammy |
RP |
$402,500 |
402500 |
0.44% |
0.44 |
-0.07 |
-0.0704708 |
— |
0 |
— |
0 |
|
 Bud Norris
 |
Norris Bud |
RP |
$401,000 |
401000 |
0.44% |
0.44 |
1.15 |
1.14943 |
2.87 |
2.8664089775561 |
$348,869 |
348868.56963886 |
|
 Tommy Manzella
 |
Manzella Tommy |
SS |
$400,000 |
400000 |
0.44% |
0.44 |
-0.33 |
-0.32817 |
— |
0 |
— |
0 |
|
 Yorman Bazardo
 |
Bazardo Yorman |
DNP |
$400,000 |
400000 |
0.44% |
0.44 |
— |
0.00 |
— |
0 |
— |
0 |
|
 Chris Johnson
 |
Johnson Chris |
3B |
$400,000 |
400000 |
0.44% |
0.44 |
1.35 |
1.34736 |
3.37 |
3.3684 |
$296,877 |
296876.85548035 |
|
 Doug Brocail
 |
Brocail Doug |
DNP |
$250,000 |
250000 |
0.27% |
0.27 |
— |
0.00 |
— |
0 |
— |
0 |
|
| Year | Astros payroll |
PR Sort |
Avg payroll |
AvgPR Sort |
Diff |
Diff Sort |
|---|
| 1989 | $78,000 | 78000 | $862,714 | 862714 | $-784,714 | -784714 |
| 1990 | $240,000 | 240000 | $1,203,571 | 1203571 | $-963,571 | -963571 |
| 1991 | $437,500 | 437500 | $1,884,642 | 1884642 | $-1,447,142 | -1447142 |
| 1992 | $1,375,000 | 1375000 | $2,356,071 | 2356071 | $-981,071 | -981071 |
| 1993 | $3,050,000 | 3050000 | $3,410,000 | 3410000 | $-360,000 | -360000 |
| 1994 | $3,375,000 | 3375000 | $3,911,904 | 3911904 | $-536,904 | -536904 |
| 1995 | $4,600,000 | 4600000 | $5,208,333 | 5208333 | $-608,333 | -608333 |
| 1996 | $2,000,000 | 2000000 | $4,583,416 | 4583416 | $-2,583,416 | -2583416 |
| 1997 | $6,180,000 | 6180000 | $4,892,222 | 4892222 | $1,287,778 | 1287778 |
| 1998 | $6,120,000 | 6120000 | $6,661,904 | 6661904 | $-541,904 | -541904 |
| 1999 | $6,060,000 | 6060000 | $7,867,823 | 7867823 | $-1,807,823 | -1807823 |
| 2000 | $51,806,667 | 51806667 | $56,164,089 | 56164089 | $-4,357,422 | -4357422 |
| 2001 | $59,632,667 | 59632667 | $65,991,638 | 65991638 | $-6,358,971 | -6358971 |
| 2002 | $65,156,750 | 65156750 | $68,244,471 | 68244471 | $-3,087,721 | -3087721 |
| 2003 | $71,040,000 | 71040000 | $71,318,479 | 71318479 | $-278,479 | -278479 |
| 2004 | $75,727,000 | 75727000 | $70,466,961 | 70466961 | $5,260,039 | 5260039 |
| 2005 | $78,786,000 | 78786000 | $73,264,780 | 73264780 | $5,521,220 | 5521220 |
| 2006 | $95,998,000 | 95998000 | $79,051,754 | 79051754 | $16,946,246 | 16946246 |
| 2007 | $90,230,500 | 90230500 | $83,931,138 | 83931138 | $6,299,362 | 6299362 |
| 2008 | $96,369,000 | 96369000 | $90,812,373 | 90812373 | $5,556,627 | 5556627 |
| 2009 | $103,590,000 | 103590000 | $91,093,211 | 91093211 | $12,496,789 | 12496789 |
| 2010 | $91,605,500 | 91605500 | $93,373,681 | 93373681 | $-1,768,181 | -1768181 |
| 2011 | $77,694,000 | 77694000 | $96,102,034 | 96102034 | $-18,408,034 | -18408034 |
| 2012 | $60,799,000 | 60799000 | $100,657,138 | 100657138 | $-39,858,138 | -39858138 |
| 2013 | $26,105,600 | 26105600 | $109,024,990 | 109024990 | $-82,919,390 | -82919390 |
| 2014 | $51,985,800 | 51985800 | $117,828,782 | 117828782 | $-65,842,982 | -65842982 |
| 2015 | $72,464,200 | 72464200 | $127,404,244 | 127404244 | $-54,940,044 | -54940044 |
| 2016 | $98,793,700 | 98793700 | $132,219,407 | 132219407 | $-33,425,707 | -33425707 |
| 2017 | $124,343,900 | 124343900 | $137,302,894 | 137302894 | $-12,958,994 | -12958994 |
| 2018 | $160,393,900 | 160393900 | $136,929,168 | 136929168 | $23,464,732 | 23464732 |
| 2019 | $158,043,000 | 158043000 | $136,944,257 | 136944257 | $21,098,743 | 21098743 |
| 2020 | $210,899,457 | 210899457 | $140,677,788 | 140677788 | $70,221,669 | 70221669 |
| 2021 | $187,448,657 | 187448657 | $132,162,631 | 132162631 | $55,286,026 | 55286026 |
| 2022 | $173,879,000 | 173879000 | $149,374,046 | 149374046 | $24,504,954 | 24504954 |
| 2023 | $190,917,233 | 190917233 | $160,460,390 | 160460390 | $30,456,843 | 30456843 |
| 2024 | $176,933,333 | 176933333 | $135,504,022 | 135504022 | $41,429,311 | 41429311 |
| 2025 | $101,933,333 | 101933333 | $96,417,302 | 96417302 | $5,516,031 | 5516031 |
| 2026 | $84,933,333 | 84933333 | $76,694,120 | 76694120 | $8,239,213 | 8239213 |
| 2027 | $67,233,333 | 67233333 | $58,935,617 | 58935617 | $8,297,716 | 8297716 |
| 2028 | $45,833,333 | 45833333 | $45,437,759 | 45437759 | $395,574 | 395574 |
|
 2010 Houston Astros