| Player | Player Sort | Pos | Salary | Salary Sort | Pct | Pct Sort | WARP | WARP Sort | WARP/$M | WARP/$M Sort | $/WARP | $/WARP Sort | Current Status |
|---|
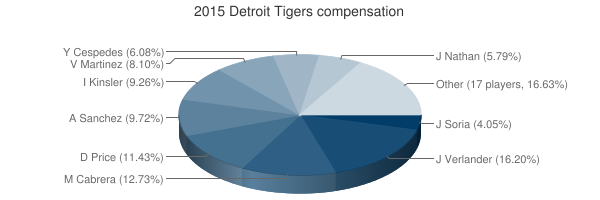
 Justin Verlander
 |
Verlander Justin |
RP |
$28,000,000 |
28000000 |
16.20% |
16.20 |
0.75 |
0.752859 |
0.03 |
0.026887821428571 |
$37,191,559 |
37191559.110006 |
|
 Miguel Cabrera
 |
Cabrera Miguel |
1B |
$22,000,000 |
22000000 |
12.73% |
12.73 |
4.68 |
4.67591 |
0.21 |
0.21254136363636 |
$4,704,967 |
4704966.519886 |
|
 David Price
 |
Price David |
RP |
$19,750,000 |
19750000 |
11.43% |
11.43 |
3.56 |
3.55873 |
0.18 |
0.18018886075949 |
$5,549,733 |
5549732.6293369 |
|
 Aníbal Sánchez
 |
Sanchez Anibal |
RP |
$16,800,000 |
16800000 |
9.72% |
9.72 |
0.93 |
0.925903 |
0.06 |
0.055113273809524 |
$18,144,449 |
18144449.256564 |
|
 Ian Kinsler
 |
Kinsler Ian |
2B |
$16,000,000 |
16000000 |
9.26% |
9.26 |
2.58 |
2.57699 |
0.16 |
0.161061875 |
$6,208,794 |
6208793.9805742 |
|
 Victor Martinez
 |
Martinez Victor |
DH |
$14,000,000 |
14000000 |
8.10% |
8.10 |
-1.32 |
-1.32085 |
— |
0 |
— |
0 |
|
 Yoenis Céspedes
 |
Cespedes Yoenis |
LF |
$10,500,000 |
10500000 |
6.08% |
6.08 |
3.76 |
3.75503 |
0.36 |
0.3576219047619 |
$2,796,249 |
2796249.2976088 |
|
 Joe Nathan
 |
Nathan Joe |
RP |
$10,000,000 |
10000000 |
5.79% |
5.79 |
0.01 |
0.0135224 |
0.00 |
0.00135224 |
$739,513,696 |
739513695.79365 |
|
 Joakim Soria
 |
Soria Joakim |
RP |
$7,000,000 |
7000000 |
4.05% |
4.05 |
0.52 |
0.521897 |
0.07 |
0.074556714285714 |
$13,412,608 |
13412608.234958 |
|
 Alfredo Simon
 |
Simon Alfredo |
RP |
$5,550,000 |
5550000 |
3.21% |
3.21 |
-2.56 |
-2.55527 |
— |
0 |
— |
0 |
|
 Alex Avila
 |
Avila Alex |
C |
$5,400,000 |
5400000 |
3.13% |
3.13 |
-1.02 |
-1.01783 |
— |
0 |
— |
0 |
|
 Rajai Davis
 |
Davis Rajai |
CF |
$5,000,000 |
5000000 |
2.89% |
2.89 |
0.75 |
0.745125 |
0.15 |
0.149025 |
$6,710,284 |
6710283.5094783 |
|
 J.D. Martinez
 |
Martinez J.D. |
RF |
$3,000,000 |
3000000 |
1.74% |
1.74 |
2.77 |
2.77198 |
0.92 |
0.92399333333333 |
$1,082,259 |
1082258.8907568 |
|
 Al Alburquerque
 |
Alburquerque Al |
RP |
$1,725,000 |
1725000 |
1.00% |
1.00 |
0.29 |
0.29117 |
0.17 |
0.16879420289855 |
$5,924,374 |
5924374.0769997 |
|
 José Iglesias
 |
Iglesias Jose |
SS |
$1,443,750 |
1443750 |
0.84% |
0.84 |
0.29 |
0.294073 |
0.20 |
0.20368692640693 |
$4,909,495 |
4909495.2613807 |
|
 Joba Chamberlain
 |
Chamberlain Joba |
RP |
$1,000,000 |
1000000 |
0.58% |
0.58 |
-0.01 |
-0.00626764 |
— |
0 |
— |
0 |
|
 Tom Gorzelanny
 |
Gorzelanny Tom |
RP |
$1,000,000 |
1000000 |
0.58% |
0.58 |
-0.81 |
-0.810382 |
— |
0 |
— |
0 |
|
 Nick Castellanos
 |
Castellanos Nick |
3B |
$525,000 |
525000 |
0.30% |
0.30 |
1.16 |
1.16098 |
2.21 |
2.2113904761905 |
$452,204 |
452204.17233716 |
|
 Andrew Romine
 |
Romine Andrew |
3B |
$520,000 |
520000 |
0.30% |
0.30 |
0.09 |
0.0935812 |
0.18 |
0.17996384615385 |
$5,556,672 |
5556671.6391754 |
|
 Shane Greene
 |
Greene Shane |
RP |
$515,000 |
515000 |
0.30% |
0.30 |
-1.15 |
-1.14616 |
— |
0 |
— |
0 |
|
 Ian Krol
 |
Krol Ian |
RP |
$515,000 |
515000 |
0.30% |
0.30 |
-0.52 |
-0.521351 |
— |
0 |
— |
0 |
|
 Anthony Gose
 |
Gose Anthony |
CF |
$515,000 |
515000 |
0.30% |
0.30 |
1.42 |
1.41965 |
2.76 |
2.7566019417476 |
$362,765 |
362765.47036241 |
|
 Bruce Rondón
 |
Rondon Bruce |
RP |
$510,000 |
510000 |
0.30% |
0.30 |
-0.04 |
-0.0383527 |
— |
0 |
— |
0 |
|
 Hernán Pérez
 |
Perez Hernan |
3B |
$508,500 |
508500 |
0.29% |
0.29 |
-0.74 |
-0.743321 |
— |
0 |
— |
0 |
|
 Angel Nesbitt
 |
Nesbitt Angel |
RP |
$507,500 |
507500 |
0.29% |
0.29 |
0.18 |
0.17617 |
0.35 |
0.34713300492611 |
$2,880,740 |
2880740.1941307 |
|
 James McCann
 |
McCann James |
C |
$507,500 |
507500 |
0.29% |
0.29 |
-1.14 |
-1.13788 |
— |
0 |
— |
0 |
|
| Year | Tigers payroll |
PR Sort |
Avg payroll |
AvgPR Sort |
Diff |
Diff Sort |
|---|
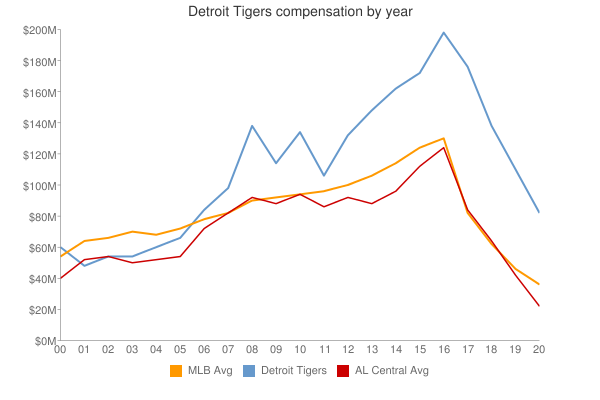
| 2000 | $60,225,167 | 60225167 | $57,491,092 | 57491092 | $2,734,075 | 2734075 |
| 2001 | $48,524,167 | 48524167 | $67,120,750 | 67120750 | $-18,596,583 | -18596583 |
| 2002 | $54,640,500 | 54640500 | $69,204,705 | 69204705 | $-14,564,205 | -14564205 |
| 2003 | $55,968,000 | 55968000 | $72,156,639 | 72156639 | $-16,188,639 | -16188639 |
| 2004 | $61,141,000 | 61141000 | $71,426,357 | 71426357 | $-10,285,357 | -10285357 |
| 2005 | $67,868,500 | 67868500 | $73,628,169 | 73628169 | $-5,759,669 | -5759669 |
| 2006 | $85,198,456 | 85198456 | $81,192,832 | 81192832 | $4,005,624 | 4005624 |
| 2007 | $97,708,500 | 97708500 | $85,747,487 | 85747487 | $11,961,013 | 11961013 |
| 2008 | $138,175,833 | 138175833 | $93,079,041 | 93079041 | $45,096,792 | 45096792 |
| 2009 | $116,053,000 | 116053000 | $92,957,049 | 92957049 | $23,095,951 | 23095951 |
| 2010 | $134,062,066 | 134062066 | $94,957,956 | 94957956 | $39,104,110 | 39104110 |
| 2011 | $107,019,667 | 107019667 | $97,426,414 | 97426414 | $9,593,253 | 9593253 |
| 2012 | $133,060,667 | 133060667 | $100,689,500 | 100689500 | $32,371,167 | 32371167 |
| 2013 | $148,314,500 | 148314500 | $106,658,387 | 106658387 | $41,656,113 | 41656113 |
| 2014 | $163,635,500 | 163635500 | $115,428,670 | 115428670 | $48,206,830 | 48206830 |
| 2015 | $172,792,250 | 172792250 | $125,458,486 | 125458486 | $47,333,764 | 47333764 |
| 2016 | $198,593,000 | 198593000 | $130,290,910 | 130290910 | $68,302,090 | 68302090 |
| 2017 | $199,750,600 | 199750600 | $136,573,000 | 136573000 | $63,177,600 | 63177600 |
| 2018 | $125,286,000 | 125286000 | $135,681,867 | 135681867 | $-10,395,867 | -10395867 |
| 2019 | $115,673,500 | 115673500 | $134,776,225 | 134776225 | $-19,102,725 | -19102725 |
| 2020 | $103,966,600 | 103966600 | $138,321,485 | 138321485 | $-34,354,885 | -34354885 |
| 2021 | $82,366,200 | 82366200 | $129,635,938 | 129635938 | $-47,269,738 | -47269738 |
| 2022 | $129,413,500 | 129413500 | $147,002,411 | 147002411 | $-17,588,911 | -17588911 |
| 2023 | $122,236,500 | 122236500 | $158,155,877 | 158155877 | $-35,919,377 | -35919377 |
| 2024 | $95,073,933 | 95073933 | $133,074,721 | 133074721 | $-38,000,788 | -38000788 |
| 2025 | $39,593,333 | 39593333 | $94,180,059 | 94180059 | $-54,586,726 | -54586726 |
| 2026 | $28,333,333 | 28333333 | $74,818,461 | 74818461 | $-46,485,128 | -46485128 |
| 2027 | $28,333,333 | 28333333 | $56,972,319 | 56972319 | $-28,638,986 | -28638986 |
| 2028 | $5,333,333 | 5333333 | $45,437,759 | 45437759 | $-40,104,426 | -40104426 |
| 2029 | $5,333,333 | 5333333 | $37,269,628 | 37269628 | $-31,936,295 | -31936295 |
| 2030 | $2,642,500 | 2642500 | $39,665,769 | 39665769 | $-37,023,269 | -37023269 |
|
 2015 Detroit Tigers