| Player | Player Sort | Pos | Salary | Salary Sort | Pct | Pct Sort | WARP | WARP Sort | WARP/$M | WARP/$M Sort | $/WARP | $/WARP Sort | Current Status |
|---|
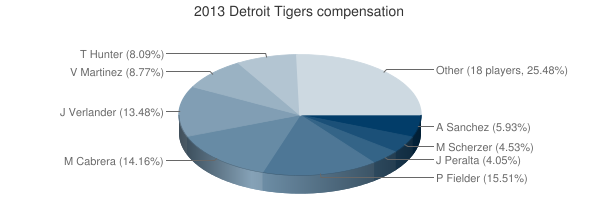
 Prince Fielder
 |
Fielder Prince |
1B |
$23,000,000 |
23000000 |
15.51% |
15.51 |
2.34 |
2.34129 |
0.10 |
0.1017952173913 |
$9,823,644 |
9823644.2303175 |
|
 Miguel Cabrera
 |
Cabrera Miguel |
3B |
$21,000,000 |
21000000 |
14.16% |
14.16 |
7.82 |
7.8244 |
0.37 |
0.37259047619048 |
$2,683,912 |
2683911.8654466 |
|
 Justin Verlander
 |
Verlander Justin |
RP |
$20,000,000 |
20000000 |
13.48% |
13.48 |
4.12 |
4.11972 |
0.21 |
0.205986 |
$4,854,699 |
4854698.8630295 |
|
 Victor Martinez
 |
Martinez Victor |
DH |
$13,000,000 |
13000000 |
8.77% |
8.77 |
1.52 |
1.51743 |
0.12 |
0.11672538461538 |
$8,567,117 |
8567116.7698016 |
|
 Torii Hunter
 |
Hunter Torii |
RF |
$12,000,000 |
12000000 |
8.09% |
8.09 |
1.98 |
1.97727 |
0.16 |
0.1647725 |
$6,068,974 |
6068973.8882398 |
|
 Aníbal Sánchez
 |
Sanchez Anibal |
RP |
$8,800,000 |
8800000 |
5.93% |
5.93 |
5.02 |
5.02401 |
0.57 |
0.57091022727273 |
$1,751,589 |
1751588.8702451 |
|
 Max Scherzer
 |
Scherzer Max |
RP |
$6,725,000 |
6725000 |
4.53% |
4.53 |
6.61 |
6.61479 |
0.98 |
0.98361189591078 |
$1,016,661 |
1016661.1487288 |
|
 Jhonny Peralta
 |
Peralta Jhonny |
SS |
$6,000,000 |
6000000 |
4.05% |
4.05 |
4.02 |
4.01569 |
0.67 |
0.66928166666667 |
$1,494,139 |
1494139.2388357 |
|
 Joaquin Benoit
 |
Benoit Joaquin |
RP |
$5,500,000 |
5500000 |
3.71% |
3.71 |
1.46 |
1.46145 |
0.27 |
0.26571818181818 |
$3,763,386 |
3763385.6786069 |
|
 Rick Porcello
 |
Porcello Rick |
RP |
$5,100,000 |
5100000 |
3.44% |
3.44 |
2.14 |
2.14148 |
0.42 |
0.41989803921569 |
$2,381,531 |
2381530.5302875 |
|
 Doug Fister
 |
Fister Doug |
RP |
$4,000,000 |
4000000 |
2.70% |
2.70 |
3.31 |
3.30537 |
0.83 |
0.8263425 |
$1,210,152 |
1210151.964833 |
|
 Omar Infante
 |
Infante Omar |
2B |
$4,000,000 |
4000000 |
2.70% |
2.70 |
3.09 |
3.08538 |
0.77 |
0.771345 |
$1,296,437 |
1296436.7436102 |
|
 Austin Jackson
 |
Jackson Austin |
CF |
$3,500,000 |
3500000 |
2.36% |
2.36 |
2.57 |
2.56846 |
0.73 |
0.73384571428571 |
$1,362,684 |
1362684.2543781 |
|
 Octavio Dotel
 |
Dotel Octavio |
RP |
$3,500,000 |
3500000 |
2.36% |
2.36 |
-0.12 |
-0.121543 |
— |
0 |
— |
0 |
|
 Alex Avila
 |
Avila Alex |
C |
$2,950,000 |
2950000 |
1.99% |
1.99 |
1.71 |
1.70595 |
0.58 |
0.57828813559322 |
$1,729,242 |
1729241.771447 |
|
 Ramon Santiago
 |
Santiago Ramon |
2B |
$2,100,000 |
2100000 |
1.42% |
1.42 |
0.14 |
0.1408 |
0.07 |
0.067047619047619 |
$14,914,773 |
14914772.727273 |
|
 Phil Coke
 |
Coke Phil |
RP |
$1,850,000 |
1850000 |
1.25% |
1.25 |
-0.21 |
-0.213618 |
— |
0 |
— |
0 |
|
 Don Kelly
 |
Kelly Don |
LF |
$900,000 |
900000 |
0.61% |
0.61 |
-0.12 |
-0.122492 |
— |
0 |
— |
0 |
|
 Brayan Peña
 |
Pena Brayan |
C |
$875,000 |
875000 |
0.59% |
0.59 |
1.26 |
1.26421 |
1.44 |
1.4448114285714 |
$692,132 |
692131.84518395 |
|
 Matt Tuiasosopo
 |
Tuiasosopo Matt |
LF |
$525,000 |
525000 |
0.35% |
0.35 |
0.74 |
0.739418 |
1.41 |
1.4084152380952 |
$710,018 |
710017.8789264 |
|
 Andy Dirks
 |
Dirks Andy |
LF |
$505,000 |
505000 |
0.34% |
0.34 |
0.96 |
0.961102 |
1.90 |
1.9031722772277 |
$525,439 |
525438.50704712 |
|
 Brayan Villarreal
 |
Villarreal Brayan |
RP |
$502,500 |
502500 |
0.34% |
0.34 |
-0.15 |
-0.154919 |
— |
0 |
— |
0 |
|
 Al Alburquerque
 |
Alburquerque Al |
RP |
$500,000 |
500000 |
0.34% |
0.34 |
0.58 |
0.575268 |
1.15 |
1.150536 |
$869,160 |
869160.11319941 |
|
 Drew Smyly
 |
Smyly Drew |
RP |
$498,000 |
498000 |
0.34% |
0.34 |
1.86 |
1.8581 |
3.73 |
3.731124497992 |
$268,016 |
268015.71497767 |
|
 Darin Downs
 |
Downs Darin |
RP |
$494,000 |
494000 |
0.33% |
0.33 |
0.21 |
0.212655 |
0.43 |
0.43047570850202 |
$2,323,011 |
2323011.4504714 |
|
 Avisaíl García
 |
Garcia Avisail |
CF |
$490,000 |
490000 |
0.33% |
0.33 |
-0.19 |
-0.192833 |
— |
0 |
— |
0 |
|
| Year | Tigers payroll |
PR Sort |
Avg payroll |
AvgPR Sort |
Diff |
Diff Sort |
|---|
| 2000 | $60,225,167 | 60225167 | $57,491,092 | 57491092 | $2,734,075 | 2734075 |
| 2001 | $48,524,167 | 48524167 | $67,120,750 | 67120750 | $-18,596,583 | -18596583 |
| 2002 | $54,640,500 | 54640500 | $69,204,705 | 69204705 | $-14,564,205 | -14564205 |
| 2003 | $55,968,000 | 55968000 | $72,156,639 | 72156639 | $-16,188,639 | -16188639 |
| 2004 | $61,141,000 | 61141000 | $71,426,357 | 71426357 | $-10,285,357 | -10285357 |
| 2005 | $67,868,500 | 67868500 | $73,628,169 | 73628169 | $-5,759,669 | -5759669 |
| 2006 | $85,198,456 | 85198456 | $81,192,832 | 81192832 | $4,005,624 | 4005624 |
| 2007 | $97,708,500 | 97708500 | $85,747,487 | 85747487 | $11,961,013 | 11961013 |
| 2008 | $138,175,833 | 138175833 | $93,079,041 | 93079041 | $45,096,792 | 45096792 |
| 2009 | $116,053,000 | 116053000 | $92,957,049 | 92957049 | $23,095,951 | 23095951 |
| 2010 | $134,062,066 | 134062066 | $94,957,956 | 94957956 | $39,104,110 | 39104110 |
| 2011 | $107,019,667 | 107019667 | $97,426,414 | 97426414 | $9,593,253 | 9593253 |
| 2012 | $133,060,667 | 133060667 | $100,689,500 | 100689500 | $32,371,167 | 32371167 |
| 2013 | $148,314,500 | 148314500 | $106,658,387 | 106658387 | $41,656,113 | 41656113 |
| 2014 | $163,635,500 | 163635500 | $115,428,670 | 115428670 | $48,206,830 | 48206830 |
| 2015 | $172,792,250 | 172792250 | $125,458,486 | 125458486 | $47,333,764 | 47333764 |
| 2016 | $198,593,000 | 198593000 | $130,290,910 | 130290910 | $68,302,090 | 68302090 |
| 2017 | $199,750,600 | 199750600 | $136,573,000 | 136573000 | $63,177,600 | 63177600 |
| 2018 | $125,286,000 | 125286000 | $135,681,867 | 135681867 | $-10,395,867 | -10395867 |
| 2019 | $115,673,500 | 115673500 | $134,776,225 | 134776225 | $-19,102,725 | -19102725 |
| 2020 | $103,966,600 | 103966600 | $138,321,485 | 138321485 | $-34,354,885 | -34354885 |
| 2021 | $82,366,200 | 82366200 | $129,635,938 | 129635938 | $-47,269,738 | -47269738 |
| 2022 | $129,413,500 | 129413500 | $147,002,411 | 147002411 | $-17,588,911 | -17588911 |
| 2023 | $122,236,500 | 122236500 | $158,155,877 | 158155877 | $-35,919,377 | -35919377 |
| 2024 | $95,073,933 | 95073933 | $133,074,721 | 133074721 | $-38,000,788 | -38000788 |
| 2025 | $39,593,333 | 39593333 | $94,180,059 | 94180059 | $-54,586,726 | -54586726 |
| 2026 | $28,333,333 | 28333333 | $74,818,461 | 74818461 | $-46,485,128 | -46485128 |
| 2027 | $28,333,333 | 28333333 | $56,972,319 | 56972319 | $-28,638,986 | -28638986 |
| 2028 | $5,333,333 | 5333333 | $45,437,759 | 45437759 | $-40,104,426 | -40104426 |
| 2029 | $5,333,333 | 5333333 | $37,269,628 | 37269628 | $-31,936,295 | -31936295 |
| 2030 | $2,642,500 | 2642500 | $39,665,769 | 39665769 | $-37,023,269 | -37023269 |
|
 2013 Detroit Tigers