| Player | Player Sort | Pos | Salary | Salary Sort | Pct | Pct Sort | WARP | WARP Sort | WARP/$M | WARP/$M Sort | $/WARP | $/WARP Sort | Current Status |
|---|
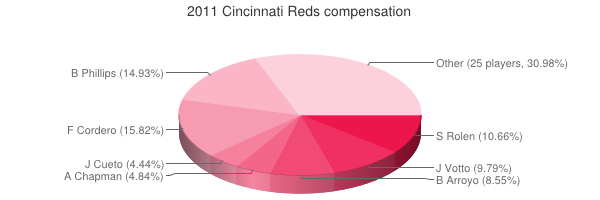
 Francisco Cordero
 |
Cordero Francisco |
RP |
$12,125,000 |
12125000 |
15.82% |
15.82 |
0.61 |
0.613173 |
0.05 |
0.050570969072165 |
$19,774,191 |
19774190.970574 |
|
 Brandon Phillips
 |
Phillips Brandon |
2B |
$11,437,500 |
11437500 |
14.93% |
14.93 |
3.47 |
3.47348 |
0.30 |
0.30369224043716 |
$3,292,807 |
3292807.213515 |
|
 Scott Rolen
 |
Rolen Scott |
3B |
$8,166,667 |
8166667 |
10.66% |
10.66 |
0.79 |
0.788286 |
0.10 |
0.096524812386742 |
$10,360,030 |
10360030.496546 |
|
 Joey Votto
 |
Votto Joey |
1B |
$7,500,000 |
7500000 |
9.79% |
9.79 |
7.47 |
7.47363 |
1.00 |
0.996484 |
$1,003,528 |
1003528.4058751 |
|
 Bronson Arroyo
 |
Arroyo Bronson |
RP |
$6,554,467 |
6554467 |
8.55% |
8.55 |
-3.14 |
-3.139 |
— |
0 |
— |
0 |
|
 Aroldis Chapman
 |
Chapman Aroldis |
RP |
$3,708,333 |
3708333 |
4.84% |
4.84 |
0.50 |
0.501692 |
0.14 |
0.13528774249777 |
$7,391,653 |
7391652.6474411 |
|
 Johnny Cueto
 |
Cueto Johnny |
RP |
$3,400,000 |
3400000 |
4.44% |
4.44 |
1.66 |
1.66382 |
0.49 |
0.48935882352941 |
$2,043,490 |
2043490.2814006 |
|
 Ramon Hernandez
 |
Hernandez Ramon |
C |
$3,000,000 |
3000000 |
3.91% |
3.91 |
1.08 |
1.07808 |
0.36 |
0.35936 |
$2,782,725 |
2782724.8441674 |
|
 Jay Bruce
 |
Bruce Jay |
RF |
$2,791,667 |
2791667 |
3.64% |
3.64 |
2.81 |
2.80574 |
1.01 |
1.0050410740249 |
$994,984 |
994984.210939 |
|
 Edgar Renteria
 |
Renteria Edgar |
SS |
$2,100,000 |
2100000 |
2.74% |
2.74 |
0.54 |
0.536755 |
0.26 |
0.25559761904762 |
$3,912,400 |
3912399.5118816 |
|
 Jonny Gomes
 |
Gomes Jonny |
LF |
$1,750,000 |
1750000 |
2.28% |
2.28 |
0.63 |
0.627436 |
0.36 |
0.35853485714286 |
$2,789,129 |
2789129.090457 |
|
 Nick Masset
 |
Masset Nick |
RP |
$1,725,000 |
1725000 |
2.25% |
2.25 |
0.53 |
0.533385 |
0.31 |
0.30920869565217 |
$3,234,062 |
3234061.7002728 |
|
 Edinson Vólquez
 |
Volquez Edinson |
RP |
$1,625,000 |
1625000 |
2.12% |
2.12 |
0.54 |
0.535641 |
0.33 |
0.32962523076923 |
$3,033,748 |
3033748.3501076 |
|
 Miguel Cairo
 |
Cairo Miguel |
3B |
$1,000,000 |
1000000 |
1.30% |
1.30 |
1.58 |
1.58185 |
1.58 |
1.58185 |
$632,171 |
632171.19195878 |
|
 Yonder Alonso
 |
Alonso Yonder |
PH |
$1,000,000 |
1000000 |
1.30% |
1.30 |
0.68 |
0.678121 |
0.68 |
0.678121 |
$1,474,663 |
1474663.0763536 |
|
 Fred Lewis
 |
Lewis Fred |
LF |
$900,000 |
900000 |
1.17% |
1.17 |
0.09 |
0.0925259 |
0.10 |
0.10280655555556 |
$9,727,006 |
9727006.1680027 |
|
 Jared Burton
 |
Burton Jared |
RP |
$750,000 |
750000 |
0.98% |
0.98 |
0.01 |
0.0123687 |
0.02 |
0.0164916 |
$60,636,930 |
60636930.31604 |
|
 Yasmani Grandal
 |
Grandal Yasmani |
DNP |
$750,000 |
750000 |
0.98% |
0.98 |
— |
0.00 |
— |
0 |
— |
0 |
|
 Bill Bray
 |
Bray Bill |
RP |
$645,000 |
645000 |
0.84% |
0.84 |
0.58 |
0.578069 |
0.90 |
0.89623100775194 |
$1,115,784 |
1115783.7559184 |
|
 Ryan Hanigan
 |
Hanigan Ryan |
C |
$550,000 |
550000 |
0.72% |
0.72 |
3.80 |
3.80451 |
6.92 |
6.9172909090909 |
$144,565 |
144565.26596066 |
|
 Jose Arredondo
 |
Arredondo Jose |
RP |
$480,000 |
480000 |
0.63% |
0.63 |
0.07 |
0.073844 |
0.15 |
0.15384166666667 |
$6,500,190 |
6500189.588863 |
|
 Drew Stubbs
 |
Stubbs Drew |
CF |
$450,000 |
450000 |
0.59% |
0.59 |
1.74 |
1.73645 |
3.86 |
3.8587777777778 |
$259,149 |
259149.41403438 |
|
 Homer Bailey
 |
Bailey Homer |
RP |
$441,000 |
441000 |
0.58% |
0.58 |
1.35 |
1.35432 |
3.07 |
3.0710204081633 |
$325,625 |
325624.66772993 |
|
 Paul Janish
 |
Janish Paul |
SS |
$437,500 |
437500 |
0.57% |
0.57 |
-0.03 |
-0.0325691 |
— |
0 |
— |
0 |
|
 Mike Leake
 |
Leake Mike |
RP |
$425,000 |
425000 |
0.55% |
0.55 |
2.27 |
2.26982 |
5.34 |
5.3407529411765 |
$187,240 |
187239.51678988 |
|
 Travis Wood
 |
Wood Travis |
RP |
$422,500 |
422500 |
0.55% |
0.55 |
-0.10 |
-0.0970298 |
— |
0 |
— |
0 |
|
 Chris Heisey
 |
Heisey Chris |
LF |
$419,000 |
419000 |
0.55% |
0.55 |
1.41 |
1.40744 |
3.36 |
3.3590453460621 |
$297,704 |
297703.63212641 |
|
 Logan Ondrusek
 |
Ondrusek Logan |
RP |
$418,000 |
418000 |
0.55% |
0.55 |
0.13 |
0.126113 |
0.30 |
0.30170574162679 |
$3,314,488 |
3314487.8006233 |
|
 Jordan Smith
 |
Smith Jordan |
RP |
$416,500 |
416500 |
0.54% |
0.54 |
-0.12 |
-0.122389 |
— |
0 |
— |
0 |
|
 Matt Maloney
 |
Maloney Matt |
RP |
$415,000 |
415000 |
0.54% |
0.54 |
-0.17 |
-0.174631 |
— |
0 |
— |
0 |
|
 Juan Francisco
 |
Francisco Juan |
3B |
$414,000 |
414000 |
0.54% |
0.54 |
0.21 |
0.205736 |
0.50 |
0.49694685990338 |
$2,012,288 |
2012287.5918653 |
|
 Sam LeCure
 |
LeCure Sam |
RP |
$414,000 |
414000 |
0.54% |
0.54 |
1.13 |
1.12583 |
2.72 |
2.7193961352657 |
$367,729 |
367728.69793841 |
|
| Year | Reds payroll |
PR Sort |
Avg payroll |
AvgPR Sort |
Diff |
Diff Sort |
|---|
| 2000 | $44,767,200 | 44767200 | $56,164,089 | 56164089 | $-11,396,889 | -11396889 |
| 2001 | $47,974,000 | 47974000 | $65,991,638 | 65991638 | $-18,017,638 | -18017638 |
| 2002 | $43,203,890 | 43203890 | $68,244,471 | 68244471 | $-25,040,581 | -25040581 |
| 2003 | $58,541,000 | 58541000 | $71,318,479 | 71318479 | $-12,777,479 | -12777479 |
| 2004 | $46,697,250 | 46697250 | $70,466,961 | 70466961 | $-23,769,711 | -23769711 |
| 2005 | $62,594,583 | 62594583 | $73,264,780 | 73264780 | $-10,670,197 | -10670197 |
| 2006 | $63,631,833 | 63631833 | $79,051,754 | 79051754 | $-15,419,921 | -15419921 |
| 2007 | $69,910,833 | 69910833 | $83,931,138 | 83931138 | $-14,020,305 | -14020305 |
| 2008 | $72,240,000 | 72240000 | $90,812,373 | 90812373 | $-18,572,373 | -18572373 |
| 2009 | $72,283,500 | 72283500 | $91,093,211 | 91093211 | $-18,809,711 | -18809711 |
| 2010 | $76,876,500 | 76876500 | $93,373,681 | 93373681 | $-16,497,181 | -16497181 |
| 2011 | $76,631,134 | 76631134 | $96,102,034 | 96102034 | $-19,470,900 | -19470900 |
| 2012 | $87,826,167 | 87826167 | $100,657,138 | 100657138 | $-12,830,971 | -12830971 |
| 2013 | $111,105,533 | 111105533 | $109,024,990 | 109024990 | $2,080,543 | 2080543 |
| 2014 | $115,384,724 | 115384724 | $117,828,782 | 117828782 | $-2,444,058 | -2444058 |
| 2015 | $115,373,953 | 115373953 | $127,404,244 | 127404244 | $-12,030,291 | -12030291 |
| 2016 | $90,416,228 | 90416228 | $132,219,407 | 132219407 | $-41,803,179 | -41803179 |
| 2017 | $95,375,786 | 95375786 | $137,302,894 | 137302894 | $-41,927,108 | -41927108 |
| 2018 | $101,337,500 | 101337500 | $136,929,168 | 136929168 | $-35,591,668 | -35591668 |
| 2019 | $127,218,214 | 127218214 | $136,944,257 | 136944257 | $-9,726,043 | -9726043 |
| 2020 | $145,670,792 | 145670792 | $140,677,788 | 140677788 | $4,993,004 | 4993004 |
| 2021 | $129,642,381 | 129642381 | $132,162,631 | 132162631 | $-2,520,250 | -2520250 |
| 2022 | $107,955,000 | 107955000 | $149,374,046 | 149374046 | $-41,419,046 | -41419046 |
| 2023 | $94,198,333 | 94198333 | $160,460,390 | 160460390 | $-66,262,057 | -66262057 |
| 2024 | $100,758,333 | 100758333 | $135,504,022 | 135504022 | $-34,745,689 | -34745689 |
| 2025 | $74,483,333 | 74483333 | $96,417,302 | 96417302 | $-21,933,969 | -21933969 |
| 2026 | $45,483,333 | 45483333 | $76,694,120 | 76694120 | $-31,210,787 | -31210787 |
| 2027 | $42,483,333 | 42483333 | $58,935,617 | 58935617 | $-16,452,284 | -16452284 |
| 2028 | $16,333,333 | 16333333 | $45,437,759 | 45437759 | $-29,104,426 | -29104426 |
| 2029 | $2,000,000 | 2000000 | $37,269,628 | 37269628 | $-35,269,628 | -35269628 |
|
 2011 Cincinnati Reds