| Player | Player Sort | Pos | Salary | Salary Sort | Pct | Pct Sort | WARP | WARP Sort | WARP/$M | WARP/$M Sort | $/WARP | $/WARP Sort | Current Status |
|---|
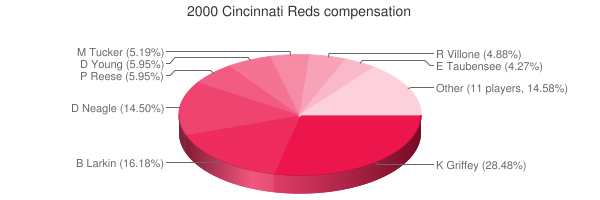
 Ken Griffey Jr.
 |
Griffey Ken |
CF |
$9,329,700 |
9329700 |
20.84% |
20.84 |
5.06 |
5.06265 |
0.54 |
0.5426380269462 |
$1,842,849 |
1842849.1007674 |
|
 Dante Bichette
 |
Bichette Dante |
RF |
$7,000,000 |
7000000 |
15.64% |
15.64 |
0.36 |
0.360271 |
0.05 |
0.051467285714286 |
$19,429,818 |
19429818.109146 |
|
 Barry Larkin
 |
Larkin Barry |
SS |
$5,300,000 |
5300000 |
11.84% |
11.84 |
1.70 |
1.70408 |
0.32 |
0.32152452830189 |
$3,110,183 |
3110182.6205342 |
|
 Denny Neagle
 |
Neagle Denny |
RP |
$4,750,000 |
4750000 |
10.61% |
10.61 |
1.84 |
1.84231 |
0.39 |
0.38785473684211 |
$2,578,285 |
2578284.8706244 |
|
 Pete Harnisch
 |
Harnisch Pete |
RP |
$3,250,000 |
3250000 |
7.26% |
7.26 |
0.83 |
0.834333 |
0.26 |
0.25671784615385 |
$3,895,327 |
3895327.1655322 |
|
 Dmitri Young
 |
Young Dmitri |
LF |
$1,950,000 |
1950000 |
4.36% |
4.36 |
0.66 |
0.655469 |
0.34 |
0.33613794871795 |
$2,974,969 |
2974969.0679498 |
|
 Pokey Reese
 |
Reese Pokey |
2B |
$1,950,000 |
1950000 |
4.36% |
4.36 |
1.52 |
1.52176 |
0.78 |
0.78038974358974 |
$1,281,411 |
1281410.997792 |
|
 Michael Tucker
 |
Tucker Michael |
RF |
$1,700,000 |
1700000 |
3.80% |
3.80 |
1.69 |
1.68593 |
0.99 |
0.99172352941176 |
$1,008,346 |
1008345.542223 |
|
 Ron Villone
 |
Villone Ron |
RP |
$1,600,000 |
1600000 |
3.57% |
3.57 |
-1.94 |
-1.93853 |
— |
0 |
— |
0 |
|
 Steve Parris
 |
Parris Steve |
RP |
$1,400,000 |
1400000 |
3.13% |
3.13 |
1.97 |
1.97424 |
1.41 |
1.4101714285714 |
$709,134 |
709133.64129994 |
|
 Eddie Taubensee
 |
Taubensee Eddie |
C |
$1,400,000 |
1400000 |
3.13% |
3.13 |
-1.30 |
-1.30462 |
— |
0 |
— |
0 |
|
 Scott Sullivan
 |
Sullivan Scott |
RP |
$1,100,000 |
1100000 |
2.46% |
2.46 |
2.03 |
2.02786 |
1.84 |
1.8435090909091 |
$542,444 |
542443.75844486 |
|
 Benito Santiago
 |
Santiago Benito |
C |
$650,000 |
650000 |
1.45% |
1.45 |
-0.77 |
-0.773653 |
— |
0 |
— |
0 |
|
 Gabe White
 |
White Gabe |
RP |
$630,000 |
630000 |
1.41% |
1.41 |
0.04 |
0.0401516 |
0.06 |
0.063732698412698 |
$15,690,533 |
15690532.880383 |
|
 Danny Graves
 |
Graves Danny |
RP |
$400,000 |
400000 |
0.89% |
0.89 |
0.76 |
0.757987 |
1.89 |
1.8949675 |
$527,714 |
527713.53598413 |
|
 Sean Casey
 |
Casey Sean |
1B |
$400,000 |
400000 |
0.89% |
0.89 |
1.93 |
1.92553 |
4.81 |
4.813825 |
$207,735 |
207735.01321714 |
|
 Chris Stynes
 |
Stynes Chris |
3B |
$375,000 |
375000 |
0.84% |
0.84 |
1.80 |
1.79829 |
4.80 |
4.79544 |
$208,531 |
208531.43819962 |
|
 Alex Ochoa
 |
Ochoa Alex |
LF |
$362,500 |
362500 |
0.81% |
0.81 |
1.84 |
1.84312 |
5.08 |
5.0844689655172 |
$196,677 |
196677.37314988 |
|
 Aaron Boone
 |
Boone Aaron |
3B |
$300,000 |
300000 |
0.67% |
0.67 |
1.43 |
1.42701 |
4.76 |
4.7567 |
$210,230 |
210229.7811508 |
|
 Scott Williamson
 |
Williamson Scott |
RP |
$300,000 |
300000 |
0.67% |
0.67 |
3.32 |
3.32228 |
11.07 |
11.074266666667 |
$90,299 |
90299.432919561 |
|
 Hector Mercado
 |
Mercado Hector |
RP |
$220,000 |
220000 |
0.49% |
0.49 |
0.05 |
0.0501355 |
0.23 |
0.22788863636364 |
$4,388,108 |
4388108.2267056 |
|
 Dennys Reyes
 |
Reyes Dennys |
RP |
$200,000 |
200000 |
0.45% |
0.45 |
-0.50 |
-0.503626 |
— |
0 |
— |
0 |
|
 Rob Bell
 |
Bell Rob |
RP |
$200,000 |
200000 |
0.45% |
0.45 |
2.08 |
2.07633 |
10.38 |
10.38165 |
$96,324 |
96323.802093116 |
|
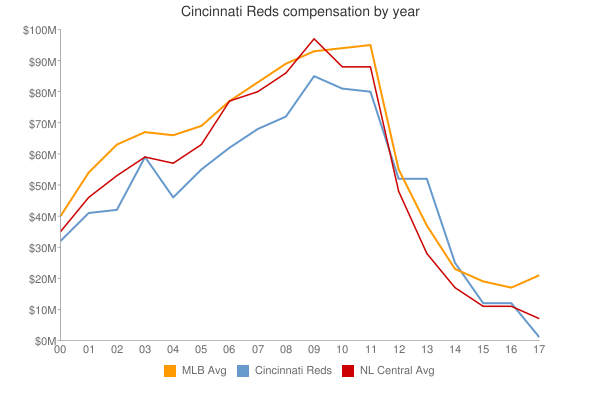
| Year | Reds payroll |
PR Sort |
Avg payroll |
AvgPR Sort |
Diff |
Diff Sort |
|---|
| 2000 | $44,767,200 | 44767200 | $55,368,142 | 55368142 | $-10,600,942 | -10600942 |
| 2001 | $47,974,000 | 47974000 | $64,937,084 | 64937084 | $-16,963,084 | -16963084 |
| 2002 | $43,203,890 | 43203890 | $67,238,672 | 67238672 | $-24,034,782 | -24034782 |
| 2003 | $58,541,000 | 58541000 | $70,654,480 | 70654480 | $-12,113,480 | -12113480 |
| 2004 | $46,697,250 | 46697250 | $69,466,729 | 69466729 | $-22,769,479 | -22769479 |
| 2005 | $62,594,583 | 62594583 | $74,114,841 | 74114841 | $-11,520,258 | -11520258 |
| 2006 | $63,631,833 | 63631833 | $79,621,815 | 79621815 | $-15,989,982 | -15989982 |
| 2007 | $69,910,833 | 69910833 | $85,537,470 | 85537470 | $-15,626,637 | -15626637 |
| 2008 | $72,240,000 | 72240000 | $92,003,799 | 92003799 | $-19,763,799 | -19763799 |
| 2009 | $72,283,500 | 72283500 | $92,169,598 | 92169598 | $-19,886,098 | -19886098 |
| 2010 | $76,876,500 | 76876500 | $94,342,601 | 94342601 | $-17,466,101 | -17466101 |
| 2011 | $76,631,134 | 76631134 | $96,974,710 | 96974710 | $-20,343,576 | -20343576 |
| 2012 | $87,826,167 | 87826167 | $100,947,217 | 100947217 | $-13,121,050 | -13121050 |
| 2013 | $111,105,533 | 111105533 | $108,586,966 | 108586966 | $2,518,567 | 2518567 |
| 2014 | $115,384,724 | 115384724 | $117,131,361 | 117131361 | $-1,746,637 | -1746637 |
| 2015 | $115,373,953 | 115373953 | $126,168,161 | 126168161 | $-10,794,208 | -10794208 |
| 2016 | $90,416,228 | 90416228 | $131,756,569 | 131756569 | $-41,340,341 | -41340341 |
| 2017 | $95,375,786 | 95375786 | $136,337,445 | 136337445 | $-40,961,659 | -40961659 |
| 2018 | $101,337,500 | 101337500 | $135,360,600 | 135360600 | $-34,023,100 | -34023100 |
| 2019 | $127,218,214 | 127218214 | $134,792,134 | 134792134 | $-7,573,920 | -7573920 |
| 2020 | $145,670,792 | 145670792 | $139,496,467 | 139496467 | $6,174,325 | 6174325 |
| 2021 | $129,642,381 | 129642381 | $130,712,288 | 130712288 | $-1,069,907 | -1069907 |
| 2022 | $107,955,000 | 107955000 | $149,802,695 | 149802695 | $-41,847,695 | -41847695 |
| 2023 | $94,198,333 | 94198333 | $161,692,345 | 161692345 | $-67,494,012 | -67494012 |
| 2024 | $100,758,333 | 100758333 | $136,306,249 | 136306249 | $-35,547,916 | -35547916 |
| 2025 | $74,483,333 | 74483333 | $98,329,527 | 98329527 | $-23,846,194 | -23846194 |
| 2026 | $45,483,333 | 45483333 | $78,039,273 | 78039273 | $-32,555,940 | -32555940 |
| 2027 | $42,483,333 | 42483333 | $60,919,343 | 60919343 | $-18,436,010 | -18436010 |
| 2028 | $16,333,333 | 16333333 | $46,901,712 | 46901712 | $-30,568,379 | -30568379 |
| 2029 | $2,000,000 | 2000000 | $38,597,944 | 38597944 | $-36,597,944 | -36597944 |
|
 2000 Cincinnati Reds