| Player | Player Sort | Pos | Salary | Salary Sort | Pct | Pct Sort | WARP | WARP Sort | WARP/$M | WARP/$M Sort | $/WARP | $/WARP Sort | Current Status |
|---|
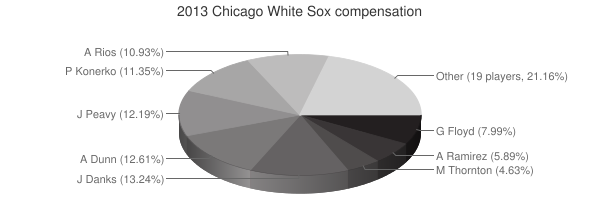
 John Danks
 |
Danks John |
RP |
$15,750,000 |
15750000 |
13.24% |
13.24 |
-0.52 |
-0.522191 |
— |
0 |
— |
0 |
|
 Adam Dunn
 |
Dunn Adam |
DH |
$15,000,000 |
15000000 |
12.61% |
12.61 |
1.17 |
1.16907 |
0.08 |
0.077938 |
$12,830,712 |
12830711.591265 |
|
 Jake Peavy
 |
Peavy Jake |
RP |
$14,500,000 |
14500000 |
12.19% |
12.19 |
1.03 |
1.02879 |
0.07 |
0.070951034482759 |
$14,094,227 |
14094227.198942 |
|
 Paul Konerko
 |
Konerko Paul |
1B |
$13,500,000 |
13500000 |
11.35% |
11.35 |
-1.07 |
-1.07368 |
— |
0 |
— |
0 |
|
 Alex Rios
 |
Rios Alex |
RF |
$13,000,000 |
13000000 |
10.93% |
10.93 |
2.18 |
2.18449 |
0.17 |
0.16803769230769 |
$5,951,046 |
5951045.781853 |
|
 Gavin Floyd
 |
Floyd Gavin |
RP |
$9,500,000 |
9500000 |
7.99% |
7.99 |
0.66 |
0.658526 |
0.07 |
0.069318526315789 |
$14,426,158 |
14426157.813055 |
|
 Alexei Ramirez
 |
Ramirez Alexei |
SS |
$7,000,000 |
7000000 |
5.89% |
5.89 |
2.34 |
2.34411 |
0.33 |
0.33487285714286 |
$2,986,208 |
2986207.9851202 |
|
 Matt Thornton
 |
Thornton Matt |
RP |
$5,500,000 |
5500000 |
4.63% |
4.63 |
0.14 |
0.142757 |
0.03 |
0.025955818181818 |
$38,527,007 |
38527007.43221 |
|
 Jesse Crain
 |
Crain Jesse |
RP |
$4,500,000 |
4500000 |
3.78% |
3.78 |
0.96 |
0.962695 |
0.21 |
0.21393222222222 |
$4,674,378 |
4674377.6585523 |
|
 Jeff Keppinger
 |
Keppinger Jeff |
2B |
$3,500,000 |
3500000 |
2.94% |
2.94 |
-0.23 |
-0.233635 |
— |
0 |
— |
0 |
|
 Gordon Beckham
 |
Beckham Gordon |
2B |
$2,925,000 |
2925000 |
2.46% |
2.46 |
0.69 |
0.692609 |
0.24 |
0.2367894017094 |
$4,223,162 |
4223161.9860556 |
|
 Dayan Viciedo
 |
Viciedo Dayan |
LF |
$2,800,000 |
2800000 |
2.35% |
2.35 |
0.29 |
0.287199 |
0.10 |
0.10257107142857 |
$9,749,338 |
9749337.5673314 |
|
 Matt Lindstrom
 |
Lindstrom Matt |
RP |
$2,300,000 |
2300000 |
1.93% |
1.93 |
0.37 |
0.368835 |
0.16 |
0.16036304347826 |
$6,235,851 |
6235850.7191563 |
|
 Alejandro De Aza
 |
De Aza Alejandro |
CF |
$2,075,000 |
2075000 |
1.74% |
1.74 |
2.88 |
2.87711 |
1.39 |
1.3865590361446 |
$721,210 |
721209.82513703 |
|
 Chris Sale
 |
Sale Chris |
RP |
$850,000 |
850000 |
0.71% |
0.71 |
5.46 |
5.46424 |
6.43 |
6.4285176470588 |
$155,557 |
155556.85694625 |
|
 Dewayne Wise
 |
Wise Dewayne |
CF |
$700,000 |
700000 |
0.59% |
0.59 |
-0.00 |
-0.00445174 |
— |
0 |
— |
0 |
|
 Addison Reed
 |
Reed Addison |
RP |
$520,000 |
520000 |
0.44% |
0.44 |
1.02 |
1.01731 |
1.96 |
1.9563653846154 |
$511,152 |
511151.95957968 |
|
 Tyler Flowers
 |
Flowers Tyler |
C |
$510,000 |
510000 |
0.43% |
0.43 |
0.29 |
0.28806 |
0.56 |
0.56482352941176 |
$1,770,464 |
1770464.4865653 |
|
 Nate Jones
 |
Jones Nate |
RP |
$507,500 |
507500 |
0.43% |
0.43 |
1.98 |
1.98433 |
3.91 |
3.9100098522167 |
$255,754 |
255753.83126798 |
|
 Angel Sanchez
 |
Sanchez Angel |
2B |
$505,000 |
505000 |
0.42% |
0.42 |
-0.05 |
-0.0459338 |
— |
0 |
— |
0 |
|
 Héctor Santiago
 |
Santiago Hector |
RP |
$505,000 |
505000 |
0.42% |
0.42 |
-1.44 |
-1.44134 |
— |
0 |
— |
0 |
|
 José Quintana
 |
Quintana Jose |
RP |
$500,000 |
500000 |
0.42% |
0.42 |
2.36 |
2.36066 |
4.72 |
4.72132 |
$211,805 |
211805.17312955 |
|
 Donnie Veal
 |
Veal Donnie |
RP |
$497,500 |
497500 |
0.42% |
0.42 |
0.12 |
0.120568 |
0.24 |
0.24234773869347 |
$4,126,302 |
4126302.1697299 |
|
 Leyson Septimo
 |
Septimo Leyson |
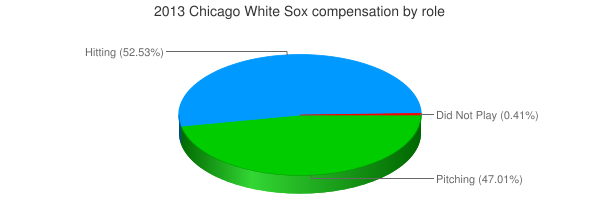
DNP |
$493,000 |
493000 |
0.41% |
0.41 |
— |
0.00 |
— |
0 |
— |
0 |
|
 Hector Gimenez
 |
Gimenez Hector |
C |
$493,000 |
493000 |
0.41% |
0.41 |
0.34 |
0.340104 |
0.69 |
0.68986612576065 |
$1,449,557 |
1449556.6062146 |
|
 Dylan Axelrod
 |
Axelrod Dylan |
RP |
$493,000 |
493000 |
0.41% |
0.41 |
-2.78 |
-2.78333 |
— |
0 |
— |
0 |
|
 Conor Gillaspie
 |
Gillaspie Conor |
3B |
$490,500 |
490500 |
0.41% |
0.41 |
1.61 |
1.60559 |
3.27 |
3.273374108053 |
$305,495 |
305495.17622805 |
|
| Year | White Sox payroll |
PR Sort |
Avg payroll |
AvgPR Sort |
Diff |
Diff Sort |
|---|
| 2000 | $31,006,000 | 31006000 | $57,491,092 | 57491092 | $-26,485,092 | -26485092 |
| 2001 | $65,906,167 | 65906167 | $67,120,750 | 67120750 | $-1,214,583 | -1214583 |
| 2002 | $57,757,833 | 57757833 | $69,204,705 | 69204705 | $-11,446,872 | -11446872 |
| 2003 | $51,180,000 | 51180000 | $72,156,639 | 72156639 | $-20,976,639 | -20976639 |
| 2004 | $67,812,500 | 67812500 | $71,426,357 | 71426357 | $-3,613,857 | -3613857 |
| 2005 | $75,695,000 | 75695000 | $73,628,169 | 73628169 | $2,066,831 | 2066831 |
| 2006 | $102,175,667 | 102175667 | $81,192,832 | 81192832 | $20,982,835 | 20982835 |
| 2007 | $108,956,833 | 108956833 | $85,747,487 | 85747487 | $23,209,346 | 23209346 |
| 2008 | $121,250,167 | 121250167 | $93,079,041 | 93079041 | $28,171,126 | 28171126 |
| 2009 | $98,473,500 | 98473500 | $92,957,049 | 92957049 | $5,516,451 | 5516451 |
| 2010 | $102,780,000 | 102780000 | $94,957,956 | 94957956 | $7,822,044 | 7822044 |
| 2011 | $127,789,000 | 127789000 | $97,426,414 | 97426414 | $30,362,586 | 30362586 |
| 2012 | $97,669,500 | 97669500 | $100,689,500 | 100689500 | $-3,020,000 | -3020000 |
| 2013 | $118,914,500 | 118914500 | $106,658,387 | 106658387 | $12,256,113 | 12256113 |
| 2014 | $90,062,658 | 90062658 | $115,428,670 | 115428670 | $-25,366,012 | -25366012 |
| 2015 | $118,619,177 | 118619177 | $125,458,486 | 125458486 | $-6,839,309 | -6839309 |
| 2016 | $114,498,667 | 114498667 | $130,290,910 | 130290910 | $-15,792,243 | -15792243 |
| 2017 | $97,823,271 | 97823271 | $136,573,000 | 136573000 | $-38,749,729 | -38749729 |
| 2018 | $71,217,000 | 71217000 | $135,681,867 | 135681867 | $-64,464,867 | -64464867 |
| 2019 | $88,902,000 | 88902000 | $134,776,225 | 134776225 | $-45,874,225 | -45874225 |
| 2020 | $124,215,000 | 124215000 | $138,321,485 | 138321485 | $-14,106,485 | -14106485 |
| 2021 | $130,741,666 | 130741666 | $129,635,938 | 129635938 | $1,105,728 | 1105728 |
| 2022 | $192,156,232 | 192156232 | $147,002,411 | 147002411 | $45,153,821 | 45153821 |
| 2023 | $181,938,668 | 181938668 | $158,155,877 | 158155877 | $23,782,791 | 23782791 |
| 2024 | $97,083,334 | 97083334 | $133,074,721 | 133074721 | $-35,991,387 | -35991387 |
| 2025 | $43,090,000 | 43090000 | $94,180,059 | 94180059 | $-51,090,059 | -51090059 |
| 2026 | $19,100,000 | 19100000 | $74,818,461 | 74818461 | $-55,718,461 | -55718461 |
| 2027 | $15,100,000 | 15100000 | $56,972,319 | 56972319 | $-41,872,319 | -41872319 |
|
 2013 Chicago White Sox