| Player | Player Sort | Pos | Salary | Salary Sort | Pct | Pct Sort | WARP | WARP Sort | WARP/$M | WARP/$M Sort | $/WARP | $/WARP Sort | Current Status |
|---|
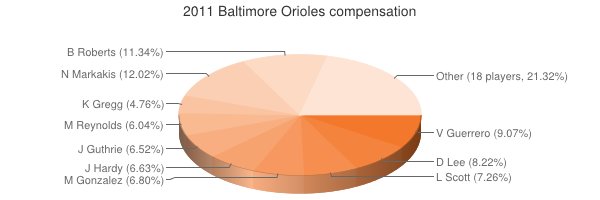
 Nick Markakis
 |
Markakis Nick |
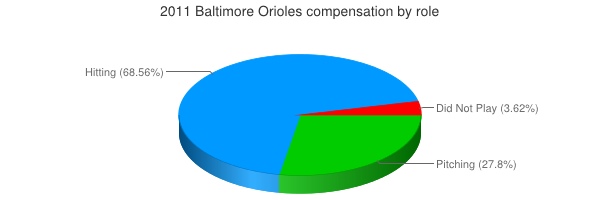
RF |
$10,600,000 |
10600000 |
12.02% |
12.02 |
1.94 |
1.93504 |
0.18 |
0.18255094339623 |
$5,477,923 |
5477922.9369936 |
|
 Brian Roberts
 |
Roberts Brian |
2B |
$10,000,000 |
10000000 |
11.34% |
11.34 |
-0.16 |
-0.161716 |
— |
0 |
— |
0 |
|
 Vladimir Guerrero
 |
Guerrero Vladimir |
DH |
$8,000,000 |
8000000 |
9.07% |
9.07 |
-0.09 |
-0.0913175 |
— |
0 |
— |
0 |
|
 Derrek Lee
 |
Lee Derrek |
1B |
$7,250,000 |
7250000 |
8.22% |
8.22 |
-1.15 |
-1.15334 |
— |
0 |
— |
0 |
|
 Luke Scott
 |
Scott Luke |
LF |
$6,400,000 |
6400000 |
7.26% |
7.26 |
0.01 |
0.0142254 |
0.00 |
0.00222271875 |
$449,899,476 |
449899475.58592 |
|
 Michael Gonzalez
 |
Gonzalez Michael |
RP |
$6,000,000 |
6000000 |
6.80% |
6.80 |
0.20 |
0.201123 |
0.03 |
0.0335205 |
$29,832,491 |
29832490.565475 |
|
 J.J. Hardy
 |
Hardy J.J. |
SS |
$5,850,000 |
5850000 |
6.63% |
6.63 |
3.97 |
3.97249 |
0.68 |
0.67905811965812 |
$1,472,628 |
1472627.9990636 |
|
 Jeremy Guthrie
 |
Guthrie Jeremy |
RP |
$5,750,000 |
5750000 |
6.52% |
6.52 |
-1.78 |
-1.77836 |
— |
0 |
— |
0 |
|
 Mark Reynolds
 |
Reynolds Mark |
3B |
$5,330,000 |
5330000 |
6.04% |
6.04 |
1.18 |
1.17601 |
0.22 |
0.22063977485929 |
$4,532,274 |
4532274.3854219 |
|
 Kevin Gregg
 |
Gregg Kevin |
RP |
$4,200,000 |
4200000 |
4.76% |
4.76 |
-0.22 |
-0.216532 |
— |
0 |
— |
0 |
|
 Adam Jones
 |
Jones Adam |
CF |
$3,250,000 |
3250000 |
3.69% |
3.69 |
4.43 |
4.42813 |
1.36 |
1.3625015384615 |
$733,944 |
733944.12539831 |
|
 Koji Uehara
 |
Uehara Koji |
RP |
$3,000,000 |
3000000 |
3.40% |
3.40 |
1.36 |
1.35722 |
0.45 |
0.45240666666667 |
$2,210,401 |
2210400.6719618 |
|
 Cesar Izturis
 |
Izturis Cesar |
SS |
$1,500,000 |
1500000 |
1.70% |
1.70 |
-0.06 |
-0.0601838 |
— |
0 |
— |
0 |
|
 Brian Matusz
 |
Matusz Brian |
RP |
$1,350,000 |
1350000 |
1.53% |
1.53 |
-1.72 |
-1.71564 |
— |
0 |
— |
0 |
|
 Brendan Harris
 |
Harris Brendan |
DNP |
$1,250,000 |
1250000 |
1.42% |
1.42 |
— |
0.00 |
— |
0 |
— |
0 |
|
 Dylan Bundy
 |
Bundy Dylan |
DNP |
$1,245,000 |
1245000 |
1.41% |
1.41 |
— |
0.00 |
— |
0 |
— |
0 |
|
 Jeremy Accardo
 |
Accardo Jeremy |
RP |
$1,080,000 |
1080000 |
1.22% |
1.22 |
-0.51 |
-0.506835 |
— |
0 |
— |
0 |
|
 Felix Pie
 |
Pie Felix |
LF |
$985,000 |
985000 |
1.12% |
1.12 |
-0.70 |
-0.697163 |
— |
0 |
— |
0 |
|
 Jim Johnson
 |
Johnson Jim |
RP |
$975,000 |
975000 |
1.11% |
1.11 |
0.47 |
0.474221 |
0.49 |
0.48638051282051 |
$2,056,003 |
2056003.4245637 |
|
 Justin Duchscherer
 |
Duchscherer Justin |
DNP |
$700,000 |
700000 |
0.79% |
0.79 |
— |
0.00 |
— |
0 |
— |
0 |
|
 Josh Rupe
 |
Rupe Josh |
RP |
$475,000 |
475000 |
0.54% |
0.54 |
-0.24 |
-0.24298 |
— |
0 |
— |
0 |
|
 Matt Wieters
 |
Wieters Matt |
C |
$452,250 |
452250 |
0.51% |
0.51 |
5.01 |
5.0147 |
11.09 |
11.088336097291 |
$90,185 |
90184.856521826 |
|
 Brad Bergesen
 |
Bergesen Brad |
RP |
$434,000 |
434000 |
0.49% |
0.49 |
-1.47 |
-1.47372 |
— |
0 |
— |
0 |
|
 Jason Berken
 |
Berken Jason |
RP |
$426,500 |
426500 |
0.48% |
0.48 |
-0.35 |
-0.354415 |
— |
0 |
— |
0 |
|
 Jake Fox
 |
Fox Jake |
C |
$424,000 |
424000 |
0.48% |
0.48 |
-0.22 |
-0.219027 |
— |
0 |
— |
0 |
|
 Robert Andino
 |
Andino Robert |
2B |
$421,500 |
421500 |
0.48% |
0.48 |
0.86 |
0.862879 |
2.05 |
2.047162514828 |
$488,481 |
488481.00370967 |
|
 Jake Arrieta
 |
Arrieta Jake |
RP |
$419,000 |
419000 |
0.48% |
0.48 |
-0.94 |
-0.936365 |
— |
0 |
— |
0 |
|
 Chris Tillman
 |
Tillman Chris |
RP |
$417,000 |
417000 |
0.47% |
0.47 |
-0.52 |
-0.515486 |
— |
0 |
— |
0 |
|
| Year | Orioles payroll |
PR Sort |
Avg payroll |
AvgPR Sort |
Diff |
Diff Sort |
|---|
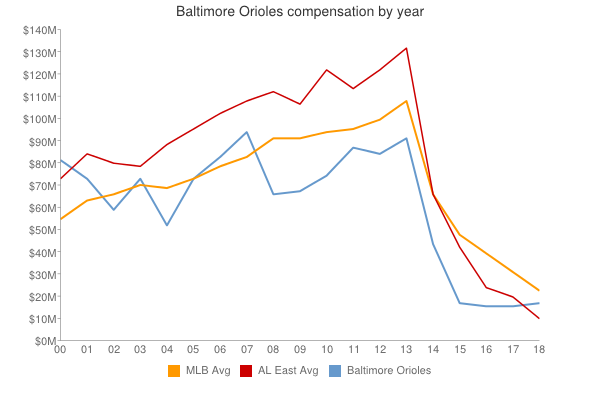
| 2000 | $82,250,111 | 82250111 | $56,164,089 | 56164089 | $26,086,022 | 26086022 |
| 2001 | $73,894,540 | 73894540 | $65,991,638 | 65991638 | $7,902,902 | 7902902 |
| 2002 | $60,496,987 | 60496987 | $68,244,471 | 68244471 | $-7,747,484 | -7747484 |
| 2003 | $73,282,500 | 73282500 | $71,318,479 | 71318479 | $1,964,021 | 1964021 |
| 2004 | $53,273,333 | 53273333 | $70,466,961 | 70466961 | $-17,193,628 | -17193628 |
| 2005 | $73,066,833 | 73066833 | $73,264,780 | 73264780 | $-197,947 | -197947 |
| 2006 | $83,729,266 | 83729266 | $79,051,754 | 79051754 | $4,677,512 | 4677512 |
| 2007 | $94,056,726 | 94056726 | $83,931,138 | 83931138 | $10,125,588 | 10125588 |
| 2008 | $66,644,581 | 66644581 | $90,812,373 | 90812373 | $-24,167,792 | -24167792 |
| 2009 | $68,369,792 | 68369792 | $91,093,211 | 91093211 | $-22,723,419 | -22723419 |
| 2010 | $75,412,500 | 75412500 | $93,373,681 | 93373681 | $-17,961,181 | -17961181 |
| 2011 | $88,184,250 | 88184250 | $96,102,034 | 96102034 | $-7,917,784 | -7917784 |
| 2012 | $84,769,000 | 84769000 | $100,657,138 | 100657138 | $-15,888,138 | -15888138 |
| 2013 | $92,238,334 | 92238334 | $109,024,990 | 109024990 | $-16,786,656 | -16786656 |
| 2014 | $107,976,154 | 107976154 | $117,828,782 | 117828782 | $-9,852,628 | -9852628 |
| 2015 | $118,975,833 | 118975833 | $127,404,244 | 127404244 | $-8,428,411 | -8428411 |
| 2016 | $147,693,714 | 147693714 | $132,219,407 | 132219407 | $15,474,307 | 15474307 |
| 2017 | $164,326,172 | 164326172 | $137,302,894 | 137302894 | $27,023,278 | 27023278 |
| 2018 | $148,574,615 | 148574615 | $136,929,168 | 136929168 | $11,645,447 | 11645447 |
| 2019 | $80,814,882 | 80814882 | $136,944,257 | 136944257 | $-56,129,375 | -56129375 |
| 2020 | $62,285,088 | 62285088 | $140,677,788 | 140677788 | $-78,392,700 | -78392700 |
| 2021 | $62,525,283 | 62525283 | $132,162,631 | 132162631 | $-69,637,348 | -69637348 |
| 2022 | $43,068,167 | 43068167 | $149,374,046 | 149374046 | $-106,305,879 | -106305879 |
| 2023 | $66,889,067 | 66889067 | $160,460,390 | 160460390 | $-93,571,323 | -93571323 |
| 2024 | $52,645,666 | 52645666 | $135,504,022 | 135504022 | $-82,858,356 | -82858356 |
| 2025 | $2,000,000 | 2000000 | $96,417,302 | 96417302 | $-94,417,302 | -94417302 |
|
 2011 Baltimore Orioles