| Player | Player Sort | Pos | Salary | Salary Sort | Pct | Pct Sort | WARP | WARP Sort | WARP/$M | WARP/$M Sort | $/WARP | $/WARP Sort | Current Status |
|---|
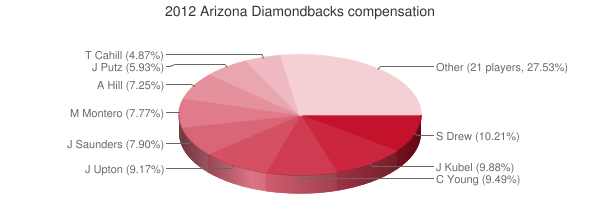
 Stephen Drew
 |
Drew Stephen |
SS |
$7,750,000 |
7750000 |
10.21% |
10.21 |
-0.38 |
-0.377924 |
— |
0 |
— |
0 |
|
 Jason Kubel
 |
Kubel Jason |
LF |
$7,500,000 |
7500000 |
9.88% |
9.88 |
1.62 |
1.61773 |
0.22 |
0.21569733333333 |
$4,636,126 |
4636125.9295432 |
|
 Chris Young
 |
Young Chris |
CF |
$7,200,000 |
7200000 |
9.49% |
9.49 |
1.25 |
1.25223 |
0.17 |
0.17392083333333 |
$5,749,742 |
5749742.4594523 |
|
 Justin Upton
 |
Upton Justin |
RF |
$6,958,333 |
6958333 |
9.17% |
9.17 |
3.45 |
3.44687 |
0.50 |
0.495358586604 |
$2,018,740 |
2018739.6101391 |
|
 Joe Saunders
 |
Saunders Joe |
RP |
$6,000,000 |
6000000 |
7.90% |
7.90 |
0.59 |
0.592526 |
0.10 |
0.098754333333333 |
$10,126,138 |
10126137.924749 |
|
 Miguel Montero
 |
Montero Miguel |
C |
$5,900,000 |
5900000 |
7.77% |
7.77 |
6.40 |
6.39644 |
1.08 |
1.0841423728814 |
$922,388 |
922388.07836859 |
|
 Aaron Hill
 |
Hill Aaron |
2B |
$5,500,000 |
5500000 |
7.25% |
7.25 |
6.71 |
6.70951 |
1.22 |
1.2199109090909 |
$819,732 |
819731.99235116 |
|
 J.J. Putz
 |
Putz J.J. |
RP |
$4,500,000 |
4500000 |
5.93% |
5.93 |
0.54 |
0.542185 |
0.12 |
0.12048555555556 |
$8,299,750 |
8299750.085303 |
|
 Trevor Cahill
 |
Cahill Trevor |
RP |
$3,700,000 |
3700000 |
4.87% |
4.87 |
1.93 |
1.92659 |
0.52 |
0.5207 |
$1,920,492 |
1920491.6458613 |
|
 Ryan Roberts
 |
Roberts Ryan |
3B |
$2,012,500 |
2012500 |
2.65% |
2.65 |
0.55 |
0.545552 |
0.27 |
0.27108173913043 |
$3,688,924 |
3688924.2455348 |
|
 Willie Bloomquist
 |
Bloomquist Willie |
SS |
$1,900,000 |
1900000 |
2.50% |
2.50 |
0.60 |
0.603962 |
0.32 |
0.31787473684211 |
$3,145,893 |
3145893.2846769 |
|
 Craig Breslow
 |
Breslow Craig |
RP |
$1,795,000 |
1795000 |
2.36% |
2.36 |
0.21 |
0.208012 |
0.12 |
0.11588412256267 |
$8,629,310 |
8629309.8475088 |
|
 Brad Ziegler
 |
Ziegler Brad |
RP |
$1,795,000 |
1795000 |
2.36% |
2.36 |
0.41 |
0.407138 |
0.23 |
0.22681782729805 |
$4,408,825 |
4408824.5263277 |
|
 Takashi Saito
 |
Saito Takashi |
RP |
$1,750,000 |
1750000 |
2.31% |
2.31 |
-0.14 |
-0.141025 |
— |
0 |
— |
0 |
|
 John McDonald
 |
McDonald John |
SS |
$1,500,000 |
1500000 |
1.98% |
1.98 |
0.30 |
0.298399 |
0.20 |
0.19893266666667 |
$5,026,826 |
5026826.4974078 |
|
 Geoff Blum
 |
Blum Geoff |
PH |
$1,350,000 |
1350000 |
1.78% |
1.78 |
-0.31 |
-0.308583 |
— |
0 |
— |
0 |
|
 Henry Blanco
 |
Blanco Henry |
C |
$1,200,000 |
1200000 |
1.58% |
1.58 |
-0.27 |
-0.273003 |
— |
0 |
— |
0 |
|
 Trevor Bauer
 |
Bauer Trevor |
RP |
$1,183,333 |
1183333 |
1.56% |
1.56 |
-0.19 |
-0.19188 |
— |
0 |
— |
0 |
|
 Lyle Overbay
 |
Overbay Lyle |
PH |
$1,000,000 |
1000000 |
1.32% |
1.32 |
-0.02 |
-0.0156951 |
— |
0 |
— |
0 |
|
 Ian Kennedy
 |
Kennedy Ian |
RP |
$519,500 |
519500 |
0.68% |
0.68 |
1.37 |
1.36626 |
2.63 |
2.6299518768046 |
$380,235 |
380235.09434515 |
|
 Daniel Hudson
 |
Hudson Daniel |
RP |
$504,000 |
504000 |
0.66% |
0.66 |
-0.17 |
-0.170045 |
— |
0 |
— |
0 |
|
 Gerardo Parra
 |
Parra Gerardo |
CF |
$502,000 |
502000 |
0.66% |
0.66 |
1.60 |
1.59901 |
3.19 |
3.1852788844622 |
$313,944 |
313944.25300655 |
|
 David Hernandez
 |
Hernandez David |
RP |
$499,000 |
499000 |
0.66% |
0.66 |
1.86 |
1.86051 |
3.73 |
3.7284769539078 |
$268,206 |
268206.02952954 |
|
 Jonathan Albaladejo
 |
Albaladejo Jonathan |
RP |
$490,000 |
490000 |
0.65% |
0.65 |
0.03 |
0.0325265 |
0.07 |
0.066380612244898 |
$15,064,640 |
15064639.601556 |
|
 Joe Paterson
 |
Paterson Joe |
RP |
$487,500 |
487500 |
0.64% |
0.64 |
-0.15 |
-0.148069 |
— |
0 |
— |
0 |
|
 Josh Collmenter
 |
Collmenter Josh |
RP |
$486,000 |
486000 |
0.64% |
0.64 |
2.11 |
2.1055 |
4.33 |
4.332304526749 |
$230,824 |
230824.03229637 |
|
 Bryan Shaw
 |
Shaw Bryan |
RP |
$483,000 |
483000 |
0.64% |
0.64 |
0.50 |
0.497489 |
1.03 |
1.0299979296066 |
$970,876 |
970875.73795602 |
|
 Paul Goldschmidt
 |
Goldschmidt Paul |
1B |
$482,000 |
482000 |
0.63% |
0.63 |
3.35 |
3.34591 |
6.94 |
6.9417219917012 |
$144,056 |
144056.47492013 |
|
 Wade Miley
 |
Miley Wade |
RP |
$481,000 |
481000 |
0.63% |
0.63 |
2.30 |
2.29513 |
4.77 |
4.77158004158 |
$209,574 |
209574.18534026 |
|
 David Winfree
 |
Winfree David |
DNP |
$480,000 |
480000 |
0.63% |
0.63 |
— |
0.00 |
— |
0 |
— |
0 |
|
| Year | Diamondbacks payroll |
PR Sort |
Avg payroll |
AvgPR Sort |
Diff |
Diff Sort |
|---|
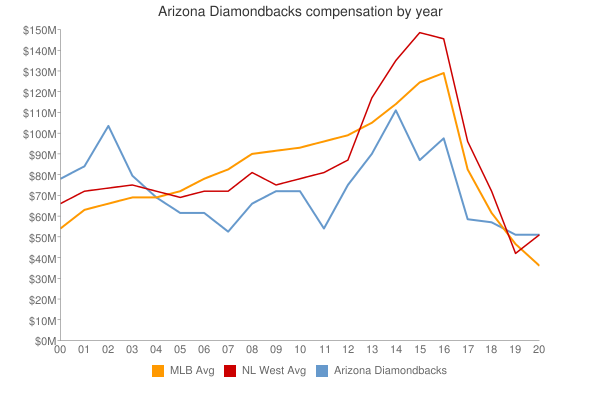
| 1999 | $8,600,000 | 8600000 | $7,867,823 | 7867823 | $732,177 | 732177 |
| 2000 | $78,869,333 | 78869333 | $57,491,092 | 57491092 | $21,378,241 | 21378241 |
| 2001 | $85,080,499 | 85080499 | $67,120,750 | 67120750 | $17,959,749 | 17959749 |
| 2002 | $104,517,499 | 104517499 | $69,204,705 | 69204705 | $35,312,794 | 35312794 |
| 2003 | $80,557,000 | 80557000 | $72,156,639 | 72156639 | $8,400,361 | 8400361 |
| 2004 | $69,935,750 | 69935750 | $71,426,357 | 71426357 | $-1,490,607 | -1490607 |
| 2005 | $62,413,833 | 62413833 | $73,628,169 | 73628169 | $-11,214,336 | -11214336 |
| 2006 | $62,073,898 | 62073898 | $81,192,832 | 81192832 | $-19,118,934 | -19118934 |
| 2007 | $52,402,000 | 52402000 | $85,747,487 | 85747487 | $-33,345,487 | -33345487 |
| 2008 | $66,138,000 | 66138000 | $93,079,041 | 93079041 | $-26,941,041 | -26941041 |
| 2009 | $73,375,000 | 73375000 | $92,957,049 | 92957049 | $-19,582,049 | -19582049 |
| 2010 | $71,984,833 | 71984833 | $94,957,956 | 94957956 | $-22,973,123 | -22973123 |
| 2011 | $55,889,833 | 55889833 | $97,426,414 | 97426414 | $-41,536,581 | -41536581 |
| 2012 | $75,908,166 | 75908166 | $100,689,500 | 100689500 | $-24,781,334 | -24781334 |
| 2013 | $90,300,500 | 90300500 | $106,658,387 | 106658387 | $-16,357,887 | -16357887 |
| 2014 | $112,315,500 | 112315500 | $115,428,670 | 115428670 | $-3,113,170 | -3113170 |
| 2015 | $88,187,000 | 88187000 | $125,458,486 | 125458486 | $-37,271,486 | -37271486 |
| 2016 | $98,172,683 | 98172683 | $130,290,910 | 130290910 | $-32,118,227 | -32118227 |
| 2017 | $93,120,200 | 93120200 | $136,573,000 | 136573000 | $-43,452,800 | -43452800 |
| 2018 | $131,965,116 | 131965116 | $135,681,867 | 135681867 | $-3,716,751 | -3716751 |
| 2019 | $123,815,766 | 123815766 | $134,776,225 | 134776225 | $-10,960,459 | -10960459 |
| 2020 | $121,918,000 | 121918000 | $138,321,485 | 138321485 | $-16,403,485 | -16403485 |
| 2021 | $96,423,700 | 96423700 | $129,635,938 | 129635938 | $-33,212,238 | -33212238 |
| 2022 | $89,856,200 | 89856200 | $147,002,411 | 147002411 | $-57,146,211 | -57146211 |
| 2023 | $113,296,972 | 113296972 | $158,155,877 | 158155877 | $-44,858,905 | -44858905 |
| 2024 | $122,750,715 | 122750715 | $133,074,721 | 133074721 | $-10,324,006 | -10324006 |
| 2025 | $63,475,000 | 63475000 | $94,180,059 | 94180059 | $-30,705,059 | -30705059 |
| 2026 | $61,225,000 | 61225000 | $74,818,461 | 74818461 | $-13,593,461 | -13593461 |
| 2027 | $51,225,000 | 51225000 | $56,972,319 | 56972319 | $-5,747,319 | -5747319 |
| 2028 | $23,625,000 | 23625000 | $45,437,759 | 45437759 | $-21,812,759 | -21812759 |
| 2029 | $28,625,000 | 28625000 | $37,269,628 | 37269628 | $-8,644,628 | -8644628 |
| 2030 | $28,625,000 | 28625000 | $39,665,769 | 39665769 | $-11,040,769 | -11040769 |
| 2031 | $5,000,000 | 5000000 | $38,360,152 | 38360152 | $-33,360,152 | -33360152 |
|
 2012 Arizona Diamondbacks