| Player | Player Sort | Pos | Salary | Salary Sort | Pct | Pct Sort | WARP | WARP Sort | WARP/$M | WARP/$M Sort | $/WARP | $/WARP Sort | Current Status |
|---|
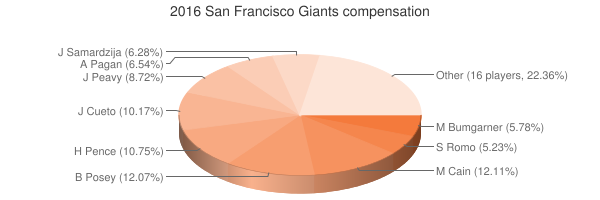
 Matt Cain
 |
Cain Matt |
SP |
$20,833,333 |
20833333 |
12.11% |
12.11 |
-0.13 |
-0.127202 |
— |
0 |
— |
0 |
|
 Buster Posey
 |
Posey Buster |
C |
$20,777,778 |
20777778 |
12.07% |
12.07 |
7.92 |
7.91898 |
0.38 |
0.38112737560292 |
$2,623,795 |
2623794.7311396 |
|
 Hunter Pence
 |
Pence Hunter |
RF |
$18,500,000 |
18500000 |
10.75% |
10.75 |
2.55 |
2.55398 |
0.14 |
0.13805297297297 |
$7,243,596 |
7243596.2693521 |
|
 Johnny Cueto
 |
Cueto Johnny |
SP |
$17,500,000 |
17500000 |
10.17% |
10.17 |
5.91 |
5.90586 |
0.34 |
0.33747771428571 |
$2,963,159 |
2963158.6255008 |
|
 Jake Peavy
 |
Peavy Jake |
SP |
$15,000,000 |
15000000 |
8.72% |
8.72 |
2.40 |
2.39578 |
0.16 |
0.15971866666667 |
$6,261,009 |
6261008.9407208 |
|
 Ángel Pagán
 |
Pagan Angel |
LF |
$11,250,000 |
11250000 |
6.54% |
6.54 |
3.28 |
3.28022 |
0.29 |
0.29157511111111 |
$3,429,648 |
3429648.0114139 |
|
 Jeff Samardzija
 |
Samardzija Jeff |
SP |
$10,800,000 |
10800000 |
6.28% |
6.28 |
4.38 |
4.38259 |
0.41 |
0.40579537037037 |
$2,464,296 |
2464296.2266605 |
|
 Madison Bumgarner
 |
Bumgarner Madison |
SP |
$9,950,000 |
9950000 |
5.78% |
5.78 |
7.79 |
7.78501 |
0.78 |
0.78241306532663 |
$1,278,097 |
1278097.2664133 |
|
 Sergio Romo
 |
Romo Sergio |
RP |
$9,000,000 |
9000000 |
5.23% |
5.23 |
0.89 |
0.886052 |
0.10 |
0.098450222222222 |
$10,157,417 |
10157417.397625 |
|
 Santiago Casilla
 |
Casilla Santiago |
RP |
$6,500,000 |
6500000 |
3.78% |
3.78 |
0.66 |
0.662378 |
0.10 |
0.10190430769231 |
$9,813,128 |
9813127.8514685 |
|
 Brandon Belt
 |
Belt Brandon |
1B |
$6,200,000 |
6200000 |
3.60% |
3.60 |
3.99 |
3.9923 |
0.64 |
0.64391935483871 |
$1,552,990 |
1552989.5047967 |
|
 Brandon Crawford
 |
Crawford Brandon |
SS |
$6,000,000 |
6000000 |
3.49% |
3.49 |
4.21 |
4.20858 |
0.70 |
0.70143 |
$1,425,659 |
1425659.0108778 |
|
 Javier López
 |
Lopez Javier |
RP |
$5,000,000 |
5000000 |
2.91% |
2.91 |
-0.61 |
-0.60994 |
— |
0 |
— |
0 |
|
 Denard Span
 |
Span Denard |
CF |
$5,000,000 |
5000000 |
2.91% |
2.91 |
0.73 |
0.726251 |
0.15 |
0.1452502 |
$6,884,672 |
6884672.1037217 |
|
 Grégor Blanco
 |
Blanco Gregor |
PH |
$3,900,000 |
3900000 |
2.27% |
2.27 |
-0.44 |
-0.444209 |
— |
0 |
— |
0 |
|
 George Kontos
 |
Kontos George |
RP |
$1,150,000 |
1150000 |
0.67% |
0.67 |
0.58 |
0.581366 |
0.51 |
0.50553565217391 |
$1,978,100 |
1978099.8544807 |
|
 Cory Gearrin
 |
Gearrin Cory |
RP |
$550,000 |
550000 |
0.32% |
0.32 |
0.65 |
0.651936 |
1.19 |
1.1853381818182 |
$843,641 |
843641.09360428 |
|
 Joe Panik
 |
Panik Joe |
2B |
$545,000 |
545000 |
0.32% |
0.32 |
2.69 |
2.68708 |
4.93 |
4.9304220183486 |
$202,822 |
202822.39456957 |
|
 Matt Duffy
 |
Duffy Matt |
3B |
$537,500 |
537500 |
0.31% |
0.31 |
1.41 |
1.4073 |
2.62 |
2.6182325581395 |
$381,937 |
381937.04256377 |
|
 Chris Heston
 |
Heston Chris |
RP |
$530,000 |
530000 |
0.31% |
0.31 |
0.08 |
0.0827979 |
0.16 |
0.15622245283019 |
$6,401,129 |
6401128.5310376 |
|
 Hunter Strickland
 |
Strickland Hunter |
RP |
$517,500 |
517500 |
0.30% |
0.30 |
0.68 |
0.679 |
1.31 |
1.312077294686 |
$762,150 |
762150.22091311 |
|
 Ehire Adrianza
 |
Adrianza Ehire |
PH |
$512,500 |
512500 |
0.30% |
0.30 |
0.19 |
0.192563 |
0.38 |
0.37573268292683 |
$2,661,467 |
2661466.6368929 |
|
 Kelby Tomlinson
 |
Tomlinson Kelby |
PH |
$512,500 |
512500 |
0.30% |
0.30 |
0.62 |
0.619331 |
1.21 |
1.2084507317073 |
$827,506 |
827505.80868712 |
|
 Josh Osich
 |
Osich Josh |
RP |
$512,500 |
512500 |
0.30% |
0.30 |
-0.55 |
-0.554085 |
— |
0 |
— |
0 |
|
 Trevor Brown
 |
Brown Trevor |
C |
$508,000 |
508000 |
0.30% |
0.30 |
-0.45 |
-0.452544 |
— |
0 |
— |
0 |
|
| Year | Giants payroll |
PR Sort |
Avg payroll |
AvgPR Sort |
Diff |
Diff Sort |
|---|
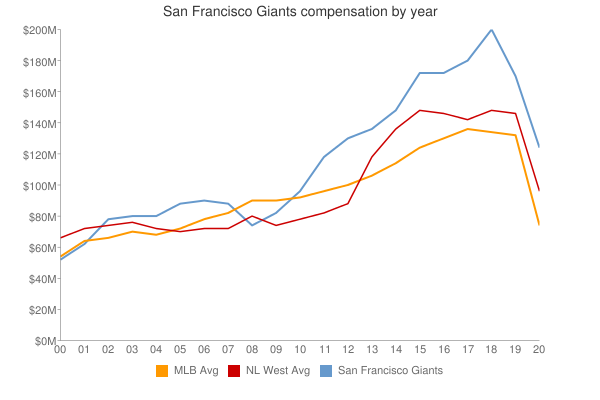
| 2000 | $53,342,826 | 53342826 | $57,491,092 | 57491092 | $-4,148,266 | -4148266 |
| 2001 | $63,289,167 | 63289167 | $67,120,750 | 67120750 | $-3,831,583 | -3831583 |
| 2002 | $78,514,835 | 78514835 | $69,204,705 | 69204705 | $9,310,130 | 9310130 |
| 2003 | $81,302,167 | 81302167 | $72,156,639 | 72156639 | $9,145,528 | 9145528 |
| 2004 | $80,400,833 | 80400833 | $71,426,357 | 71426357 | $8,974,476 | 8974476 |
| 2005 | $88,848,833 | 88848833 | $73,628,169 | 73628169 | $15,220,664 | 15220664 |
| 2006 | $90,017,671 | 90017671 | $81,192,832 | 81192832 | $8,824,839 | 8824839 |
| 2007 | $89,691,052 | 89691052 | $85,747,487 | 85747487 | $3,943,565 | 3943565 |
| 2008 | $75,877,000 | 75877000 | $93,079,041 | 93079041 | $-17,202,041 | -17202041 |
| 2009 | $82,566,450 | 82566450 | $92,957,049 | 92957049 | $-10,390,599 | -10390599 |
| 2010 | $97,023,833 | 97023833 | $94,957,956 | 94957956 | $2,065,877 | 2065877 |
| 2011 | $118,198,333 | 118198333 | $97,426,414 | 97426414 | $20,771,919 | 20771919 |
| 2012 | $131,980,298 | 131980298 | $100,689,500 | 100689500 | $31,290,798 | 31290798 |
| 2013 | $136,908,777 | 136908777 | $106,658,387 | 106658387 | $30,250,390 | 30250390 |
| 2014 | $149,439,474 | 149439474 | $115,428,670 | 115428670 | $34,010,804 | 34010804 |
| 2015 | $173,179,277 | 173179277 | $125,458,486 | 125458486 | $47,720,791 | 47720791 |
| 2016 | $172,086,611 | 172086611 | $130,290,910 | 130290910 | $41,795,701 | 41795701 |
| 2017 | $180,822,611 | 180822611 | $136,573,000 | 136573000 | $44,249,611 | 44249611 |
| 2018 | $200,505,278 | 200505278 | $135,681,867 | 135681867 | $64,823,411 | 64823411 |
| 2019 | $170,179,653 | 170179653 | $134,776,225 | 134776225 | $35,403,428 | 35403428 |
| 2020 | $155,190,747 | 155190747 | $138,321,485 | 138321485 | $16,869,262 | 16869262 |
| 2021 | $149,344,778 | 149344778 | $129,635,938 | 129635938 | $19,708,840 | 19708840 |
| 2022 | $166,189,000 | 166189000 | $147,002,411 | 147002411 | $19,186,589 | 19186589 |
| 2023 | $189,262,500 | 189262500 | $158,155,877 | 158155877 | $31,106,623 | 31106623 |
| 2024 | $189,387,903 | 189387903 | $133,074,721 | 133074721 | $56,313,182 | 56313182 |
| 2025 | $135,000,000 | 135000000 | $94,180,059 | 94180059 | $40,819,941 | 40819941 |
| 2026 | $93,750,000 | 93750000 | $74,818,461 | 74818461 | $18,931,539 | 18931539 |
| 2027 | $35,500,000 | 35500000 | $56,972,319 | 56972319 | $-21,472,319 | -21472319 |
| 2028 | $24,000,000 | 24000000 | $45,437,759 | 45437759 | $-21,437,759 | -21437759 |
|
 2016 San Francisco Giants


