| Player | Player Sort | Pos | Salary | Salary Sort | Pct | Pct Sort | WARP | WARP Sort | WARP/$M | WARP/$M Sort | $/WARP | $/WARP Sort | Current Status |
|---|
 Francisco Liriano
 |
Liriano Francisco |
SP |
$13,666,667 |
13666667 |
13.67% |
13.67 |
0.87 |
0.870923 |
0.06 |
0.063726071616437 |
$15,692,165 |
15692164.519711 |
|
 Andrew McCutchen
 |
McCutchen Andrew |
CF |
$13,208,333 |
13208333 |
13.22% |
13.22 |
2.43 |
2.4327 |
0.18 |
0.18417918445878 |
$5,429,495 |
5429495.2110823 |
|
 Mark Melancon
 |
Melancon Mark |
RP |
$9,650,000 |
9650000 |
9.66% |
9.66 |
1.11 |
1.11183 |
0.12 |
0.11521554404145 |
$8,679,384 |
8679384.4382684 |
|
 Jonathon Niese
 |
Niese Jonathon |
SP |
$9,050,000 |
9050000 |
9.05% |
9.05 |
0.09 |
0.0939872 |
0.01 |
0.010385325966851 |
$96,289,708 |
96289707.534643 |
|
 Josh Harrison
 |
Harrison Josh |
2B |
$5,250,000 |
5250000 |
5.25% |
5.25 |
1.59 |
1.5864 |
0.30 |
0.30217142857143 |
$3,309,380 |
3309379.7276853 |
|
 Jose Tabata
 |
Tabata Jose |
DNP |
$4,666,666 |
4666666 |
4.67% |
4.67 |
— |
0.00 |
— |
0 |
— |
0 |
|
 John Jaso
 |
Jaso John |
1B |
$4,000,000 |
4000000 |
4.00% |
4.00 |
0.81 |
0.805053 |
0.20 |
0.20126325 |
$4,968,617 |
4968616.973044 |
|
 Neftalí Feliz
 |
Feliz Neftali |
RP |
$3,900,000 |
3900000 |
3.90% |
3.90 |
0.62 |
0.619116 |
0.16 |
0.15874769230769 |
$6,299,304 |
6299304.1691702 |
|
 Francisco Cervelli
 |
Cervelli Francisco |
C |
$3,500,000 |
3500000 |
3.50% |
3.50 |
2.93 |
2.93082 |
0.84 |
0.83737714285714 |
$1,194,205 |
1194205.0347684 |
|
 Tony Watson
 |
Watson Tony |
RP |
$3,450,000 |
3450000 |
3.45% |
3.45 |
0.57 |
0.570184 |
0.17 |
0.16527072463768 |
$6,050,678 |
6050678.3775062 |
|
 Starling Marte
 |
Marte Starling |
LF |
$3,333,333 |
3333333 |
3.34% |
3.34 |
4.27 |
4.27257 |
1.28 |
1.2817711281771 |
$780,170 |
780170.48287097 |
|
 Jeff Locke
 |
Locke Jeff |
SP |
$3,025,000 |
3025000 |
3.03% |
3.03 |
-0.57 |
-0.572005 |
— |
0 |
— |
0 |
|
 David Freese
 |
Freese David |
3B |
$3,000,000 |
3000000 |
3.00% |
3.00 |
2.21 |
2.21368 |
0.74 |
0.73789333333333 |
$1,355,209 |
1355209.4250298 |
|
 Juan Nicasio
 |
Nicasio Juan |
SP |
$3,000,000 |
3000000 |
3.00% |
3.00 |
1.65 |
1.64599 |
0.55 |
0.54866333333333 |
$1,822,611 |
1822611.3159861 |
|
 Sean Rodríguez
 |
Rodriguez Sean |
1B |
$2,500,000 |
2500000 |
2.50% |
2.50 |
2.47 |
2.47406 |
0.99 |
0.989624 |
$1,010,485 |
1010484.7901829 |
|
 Jung Ho Kang
 |
Kang Jung Ho |
3B |
$2,500,000 |
2500000 |
2.50% |
2.50 |
3.90 |
3.89957 |
1.56 |
1.559828 |
$641,096 |
641096.32600517 |
|
 Jared Hughes
 |
Hughes Jared |
RP |
$2,175,000 |
2175000 |
2.18% |
2.18 |
-0.94 |
-0.938884 |
— |
0 |
— |
0 |
|
 Jordy Mercer
 |
Mercer Jordy |
SS |
$2,075,000 |
2075000 |
2.08% |
2.08 |
2.10 |
2.09647 |
1.01 |
1.0103469879518 |
$989,759 |
989758.97580218 |
|
 Ryan Vogelsong
 |
Vogelsong Ryan |
SP |
$2,000,000 |
2000000 |
2.00% |
2.00 |
-0.65 |
-0.645354 |
— |
0 |
— |
0 |
|
 Chris Stewart
 |
Stewart Chris |
C |
$1,350,000 |
1350000 |
1.35% |
1.35 |
0.05 |
0.0507664 |
0.04 |
0.037604740740741 |
$26,592,392 |
26592391.81821 |
|
 Cory Luebke
 |
Luebke Cory |
RP |
$1,000,000 |
1000000 |
1.00% |
1.00 |
-0.53 |
-0.525322 |
— |
0 |
— |
0 |
|
 Matt Joyce
 |
Joyce Matt |
PH |
$1,000,000 |
1000000 |
1.00% |
1.00 |
2.28 |
2.27889 |
2.28 |
2.27889 |
$438,810 |
438810.12247191 |
|
 Gerrit Cole
 |
Cole Gerrit |
SP |
$548,000 |
548000 |
0.55% |
0.55 |
1.72 |
1.7172 |
3.13 |
3.1335766423358 |
$319,124 |
319124.15560214 |
|
 Gregory Polanco
 |
Polanco Gregory |
RF |
$535,000 |
535000 |
0.54% |
0.54 |
3.28 |
3.27956 |
6.13 |
6.1300186915888 |
$163,132 |
163131.63961019 |
|
 Arquimedes Caminero
 |
Caminero Arquimedes |
RP |
$532,500 |
532500 |
0.53% |
0.53 |
-0.56 |
-0.559021 |
— |
0 |
— |
0 |
|
 Kyle Lobstein
 |
Lobstein Kyle |
RP |
$520,000 |
520000 |
0.52% |
0.52 |
-0.63 |
-0.633982 |
— |
0 |
— |
0 |
|
 Elias Díaz
 |
Diaz Elias |
C |
$510,000 |
510000 |
0.51% |
0.51 |
-0.08 |
-0.0771718 |
— |
0 |
— |
0 |
|
 Michael Morse
 |
Morse Michael |
PH |
$1 |
1 |
0.00% |
0.00 |
-0.21 |
-0.20753 |
— |
0 |
— |
0 |
|
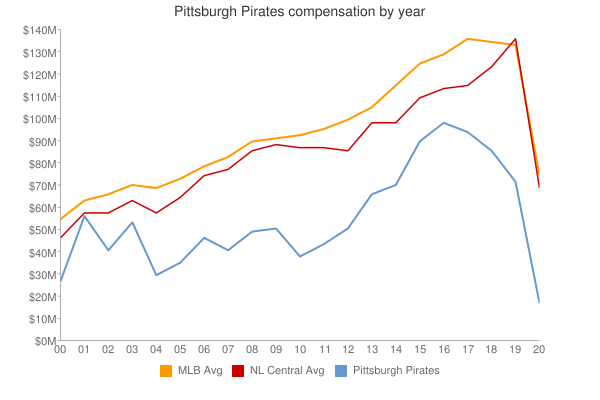
| Year | Pirates payroll |
PR Sort |
Avg payroll |
AvgPR Sort |
Diff |
Diff Sort |
|---|
| 2000 | $27,423,334 | 27423334 | $57,491,092 | 57491092 | $-30,067,758 | -30067758 |
| 2001 | $56,110,833 | 56110833 | $67,120,750 | 67120750 | $-11,009,917 | -11009917 |
| 2002 | $41,911,099 | 41911099 | $69,204,705 | 69204705 | $-27,293,606 | -27293606 |
| 2003 | $54,761,833 | 54761833 | $72,156,639 | 72156639 | $-17,394,806 | -17394806 |
| 2004 | $30,716,500 | 30716500 | $71,426,357 | 71426357 | $-40,709,857 | -40709857 |
| 2005 | $36,170,500 | 36170500 | $73,628,169 | 73628169 | $-37,457,669 | -37457669 |
| 2006 | $47,700,750 | 47700750 | $81,192,832 | 81192832 | $-33,492,082 | -33492082 |
| 2007 | $41,444,500 | 41444500 | $85,747,487 | 85747487 | $-44,302,987 | -44302987 |
| 2008 | $49,113,225 | 49113225 | $93,079,041 | 93079041 | $-43,965,816 | -43965816 |
| 2009 | $51,864,000 | 51864000 | $92,957,049 | 92957049 | $-41,093,049 | -41093049 |
| 2010 | $38,668,000 | 38668000 | $94,957,956 | 94957956 | $-56,289,956 | -56289956 |
| 2011 | $44,485,667 | 44485667 | $97,426,414 | 97426414 | $-52,940,747 | -52940747 |
| 2012 | $51,932,000 | 51932000 | $100,689,500 | 100689500 | $-48,757,500 | -48757500 |
| 2013 | $66,805,000 | 66805000 | $106,658,387 | 106658387 | $-39,853,387 | -39853387 |
| 2014 | $71,929,333 | 71929333 | $115,428,670 | 115428670 | $-43,499,337 | -43499337 |
| 2015 | $90,303,000 | 90303000 | $125,458,486 | 125458486 | $-35,155,486 | -35155486 |
| 2016 | $99,945,500 | 99945500 | $130,290,910 | 130290910 | $-30,345,410 | -30345410 |
| 2017 | $95,807,004 | 95807004 | $136,573,000 | 136573000 | $-40,765,996 | -40765996 |
| 2018 | $86,340,001 | 86340001 | $135,681,867 | 135681867 | $-49,341,866 | -49341866 |
| 2019 | $74,808,000 | 74808000 | $134,776,225 | 134776225 | $-59,968,225 | -59968225 |
| 2020 | $53,939,500 | 53939500 | $138,321,485 | 138321485 | $-84,381,985 | -84381985 |
| 2021 | $55,452,000 | 55452000 | $129,635,938 | 129635938 | $-74,183,938 | -74183938 |
| 2022 | $55,761,800 | 55761800 | $147,002,411 | 147002411 | $-91,240,611 | -91240611 |
| 2023 | $72,777,500 | 72777500 | $158,155,877 | 158155877 | $-85,378,377 | -85378377 |
| 2024 | $53,029,000 | 53029000 | $133,074,721 | 133074721 | $-80,045,721 | -80045721 |
| 2025 | $34,661,500 | 34661500 | $94,180,059 | 94180059 | $-59,518,559 | -59518559 |
| 2026 | $38,161,500 | 38161500 | $74,818,461 | 74818461 | $-36,656,961 | -36656961 |
| 2027 | $40,661,500 | 40661500 | $56,972,319 | 56972319 | $-16,310,819 | -16310819 |
| 2028 | $43,661,500 | 43661500 | $45,437,759 | 45437759 | $-1,776,259 | -1776259 |
| 2029 | $23,250,000 | 23250000 | $37,269,628 | 37269628 | $-14,019,628 | -14019628 |
| 2030 | $21,250,000 | 21250000 | $39,665,769 | 39665769 | $-18,415,769 | -18415769 |
| 2031 | $2,000,000 | 2000000 | $38,360,152 | 38360152 | $-36,360,152 | -36360152 |
|
 2016 Pittsburgh Pirates