| Player | Player Sort | Pos | Salary | Salary Sort | Pct | Pct Sort | WARP | WARP Sort | WARP/$M | WARP/$M Sort | $/WARP | $/WARP Sort | Current Status |
|---|
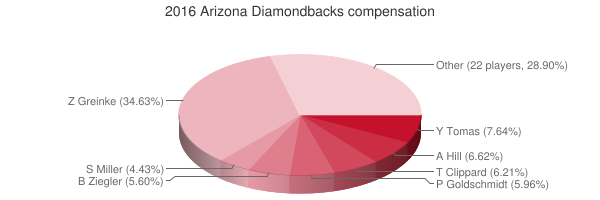
 Zack Greinke
 |
Greinke Zack |
SP |
$34,000,000 |
34000000 |
34.63% |
34.63 |
2.75 |
2.74787 |
0.08 |
0.080819705882353 |
$12,373,220 |
12373219.984934 |
|
 Yasmany Tomás
 |
Tomas Yasmany |
RF |
$7,500,000 |
7500000 |
7.64% |
7.64 |
-0.02 |
-0.0199396 |
— |
0 |
— |
0 |
|
 Aaron Hill
 |
Hill Aaron |
DNP |
$6,500,000 |
6500000 |
6.62% |
6.62 |
— |
0.00 |
— |
0 |
— |
0 |
|
 Tyler Clippard
 |
Clippard Tyler |
RP |
$6,100,000 |
6100000 |
6.21% |
6.21 |
0.28 |
0.276054 |
0.05 |
0.045254754098361 |
$22,097,126 |
22097125.924638 |
|
 Paul Goldschmidt
 |
Goldschmidt Paul |
1B |
$5,850,000 |
5850000 |
5.96% |
5.96 |
6.34 |
6.3422 |
1.08 |
1.0841367521368 |
$922,393 |
922392.86052159 |
|
 Brad Ziegler
 |
Ziegler Brad |
RP |
$5,500,000 |
5500000 |
5.60% |
5.60 |
-0.46 |
-0.464179 |
— |
0 |
— |
0 |
|
 Shelby Miller
 |
Miller Shelby |
SP |
$4,350,000 |
4350000 |
4.43% |
4.43 |
-2.20 |
-2.20217 |
— |
0 |
— |
0 |
|
 Welington Castillo
 |
Castillo Welington |
C |
$3,700,000 |
3700000 |
3.77% |
3.77 |
1.01 |
1.01295 |
0.27 |
0.27377027027027 |
$3,652,698 |
3652697.5665136 |
|
 AJ Pollock
 |
Pollock AJ |
CF |
$3,500,000 |
3500000 |
3.57% |
3.57 |
0.44 |
0.440294 |
0.13 |
0.12579828571429 |
$7,949,234 |
7949233.920971 |
|
 Daniel Hudson
 |
Hudson Daniel |
RP |
$2,700,000 |
2700000 |
2.75% |
2.75 |
-0.19 |
-0.18514 |
— |
0 |
— |
0 |
|
 Jean Segura
 |
Segura Jean |
2B |
$2,600,000 |
2600000 |
2.65% |
2.65 |
6.20 |
6.20413 |
2.39 |
2.3862038461538 |
$419,076 |
419075.68023236 |
|
 Patrick Corbin
 |
Corbin Patrick |
SP |
$2,525,000 |
2525000 |
2.57% |
2.57 |
-0.54 |
-0.5373 |
— |
0 |
— |
0 |
|
 Rubby De La Rosa
 |
De La Rosa Rubby |
SP |
$2,350,000 |
2350000 |
2.39% |
2.39 |
0.56 |
0.56385 |
0.24 |
0.23993617021277 |
$4,167,775 |
4167775.1174958 |
|
 Josh Collmenter
 |
Collmenter Josh |
RP |
$1,850,000 |
1850000 |
1.88% |
1.88 |
-0.06 |
-0.0624549 |
— |
0 |
— |
0 |
|
 Rickie Weeks Jr.
 |
Weeks Jr. Rickie |
PH |
$1,500,000 |
1500000 |
1.53% |
1.53 |
0.66 |
0.659586 |
0.44 |
0.439724 |
$2,274,154 |
2274153.7873757 |
|
 Randall Delgado
 |
Delgado Randall |
RP |
$1,275,000 |
1275000 |
1.30% |
1.30 |
-1.08 |
-1.07846 |
— |
0 |
— |
0 |
|
 Chris Owings
 |
Owings Chris |
SS |
$530,500 |
530500 |
0.54% |
0.54 |
0.99 |
0.993499 |
1.87 |
1.8727596606975 |
$533,971 |
533971.3477316 |
|
 David Peralta
 |
Peralta David |
RF |
$529,600 |
529600 |
0.54% |
0.54 |
0.44 |
0.438828 |
0.83 |
0.82860271903323 |
$1,206,851 |
1206850.9757809 |
|
 Nick Ahmed
 |
Ahmed Nick |
SS |
$521,600 |
521600 |
0.53% |
0.53 |
0.48 |
0.477094 |
0.91 |
0.9146740797546 |
$1,093,286 |
1093285.5999027 |
|
 Robbie Ray
 |
Ray Robbie |
SP |
$521,000 |
521000 |
0.53% |
0.53 |
2.77 |
2.7698 |
5.32 |
5.3163147792706 |
$188,100 |
188100.22384288 |
|
 Jake Lamb
 |
Lamb Jake |
3B |
$520,300 |
520300 |
0.53% |
0.53 |
3.34 |
3.33861 |
6.42 |
6.4167019027484 |
$155,843 |
155843.30005601 |
|
 Andrew Chafin
 |
Chafin Andrew |
RP |
$519,700 |
519700 |
0.53% |
0.53 |
-0.18 |
-0.176876 |
— |
0 |
— |
0 |
|
 Chris Herrmann
 |
Herrmann Chris |
C |
$515,900 |
515900 |
0.53% |
0.53 |
1.03 |
1.02798 |
1.99 |
1.9925954642373 |
$501,858 |
501858.01280181 |
|
 Phil Gosselin
 |
Gosselin Phil |
PH |
$513,900 |
513900 |
0.52% |
0.52 |
0.09 |
0.0908131 |
0.18 |
0.17671356294999 |
$5,658,875 |
5658875.2063304 |
|
 Silvino Bracho
 |
Bracho Silvino |
RP |
$509,300 |
509300 |
0.52% |
0.52 |
-0.71 |
-0.712514 |
— |
0 |
— |
0 |
|
 Brandon Drury
 |
Drury Brandon |
LF |
$508,900 |
508900 |
0.52% |
0.52 |
0.97 |
0.9695 |
1.91 |
1.9050894085282 |
$524,910 |
524909.74729242 |
|
 Socrates Brito
 |
Brito Socrates |
CF |
$508,500 |
508500 |
0.52% |
0.52 |
-0.40 |
-0.400595 |
— |
0 |
— |
0 |
|
 Jake Barrett
 |
Barrett Jake |
RP |
$507,500 |
507500 |
0.52% |
0.52 |
-0.07 |
-0.0738124 |
— |
0 |
— |
0 |
|
 Matt Reynolds
 |
Reynolds Matt |
DNP |
$165,983 |
165983 |
0.17% |
0.17 |
— |
0.00 |
— |
0 |
— |
0 |
|
| Year | Diamondbacks payroll |
PR Sort |
Avg payroll |
AvgPR Sort |
Diff |
Diff Sort |
|---|
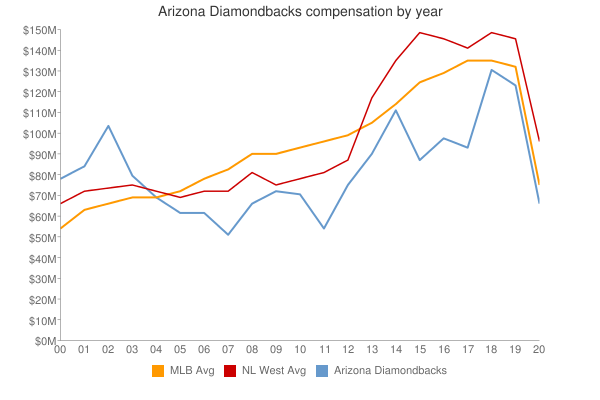
| 1999 | $8,600,000 | 8600000 | $7,867,823 | 7867823 | $732,177 | 732177 |
| 2000 | $78,869,333 | 78869333 | $57,491,092 | 57491092 | $21,378,241 | 21378241 |
| 2001 | $85,080,499 | 85080499 | $67,120,750 | 67120750 | $17,959,749 | 17959749 |
| 2002 | $104,517,499 | 104517499 | $69,204,705 | 69204705 | $35,312,794 | 35312794 |
| 2003 | $80,557,000 | 80557000 | $72,156,639 | 72156639 | $8,400,361 | 8400361 |
| 2004 | $69,935,750 | 69935750 | $71,426,357 | 71426357 | $-1,490,607 | -1490607 |
| 2005 | $62,413,833 | 62413833 | $73,628,169 | 73628169 | $-11,214,336 | -11214336 |
| 2006 | $62,073,898 | 62073898 | $81,192,832 | 81192832 | $-19,118,934 | -19118934 |
| 2007 | $52,402,000 | 52402000 | $85,747,487 | 85747487 | $-33,345,487 | -33345487 |
| 2008 | $66,138,000 | 66138000 | $93,079,041 | 93079041 | $-26,941,041 | -26941041 |
| 2009 | $73,375,000 | 73375000 | $92,957,049 | 92957049 | $-19,582,049 | -19582049 |
| 2010 | $71,984,833 | 71984833 | $94,957,956 | 94957956 | $-22,973,123 | -22973123 |
| 2011 | $55,889,833 | 55889833 | $97,426,414 | 97426414 | $-41,536,581 | -41536581 |
| 2012 | $75,908,166 | 75908166 | $100,689,500 | 100689500 | $-24,781,334 | -24781334 |
| 2013 | $90,300,500 | 90300500 | $106,658,387 | 106658387 | $-16,357,887 | -16357887 |
| 2014 | $112,315,500 | 112315500 | $115,428,670 | 115428670 | $-3,113,170 | -3113170 |
| 2015 | $88,187,000 | 88187000 | $125,458,486 | 125458486 | $-37,271,486 | -37271486 |
| 2016 | $98,172,683 | 98172683 | $130,290,910 | 130290910 | $-32,118,227 | -32118227 |
| 2017 | $93,120,200 | 93120200 | $136,573,000 | 136573000 | $-43,452,800 | -43452800 |
| 2018 | $131,965,116 | 131965116 | $135,681,867 | 135681867 | $-3,716,751 | -3716751 |
| 2019 | $123,815,766 | 123815766 | $134,776,225 | 134776225 | $-10,960,459 | -10960459 |
| 2020 | $121,918,000 | 121918000 | $138,321,485 | 138321485 | $-16,403,485 | -16403485 |
| 2021 | $96,423,700 | 96423700 | $129,635,938 | 129635938 | $-33,212,238 | -33212238 |
| 2022 | $89,856,200 | 89856200 | $147,002,411 | 147002411 | $-57,146,211 | -57146211 |
| 2023 | $113,296,972 | 113296972 | $158,155,877 | 158155877 | $-44,858,905 | -44858905 |
| 2024 | $122,750,715 | 122750715 | $133,074,721 | 133074721 | $-10,324,006 | -10324006 |
| 2025 | $63,475,000 | 63475000 | $94,180,059 | 94180059 | $-30,705,059 | -30705059 |
| 2026 | $61,225,000 | 61225000 | $74,818,461 | 74818461 | $-13,593,461 | -13593461 |
| 2027 | $51,225,000 | 51225000 | $56,972,319 | 56972319 | $-5,747,319 | -5747319 |
| 2028 | $23,625,000 | 23625000 | $45,437,759 | 45437759 | $-21,812,759 | -21812759 |
| 2029 | $28,625,000 | 28625000 | $37,269,628 | 37269628 | $-8,644,628 | -8644628 |
| 2030 | $28,625,000 | 28625000 | $39,665,769 | 39665769 | $-11,040,769 | -11040769 |
| 2031 | $5,000,000 | 5000000 | $38,360,152 | 38360152 | $-33,360,152 | -33360152 |
|
 2016 Arizona Diamondbacks


