| Player | Player Sort | Pos | Salary | Salary Sort | Pct | Pct Sort | WARP | WARP Sort | WARP/$M | WARP/$M Sort | $/WARP | $/WARP Sort | Current Status |
|---|
 B.J. Upton
 |
Upton B.J. |
CF |
$15,050,000 |
15050000 |
13.89% |
13.89 |
1.75 |
1.75101 |
0.12 |
0.11634617940199 |
$8,595,039 |
8595039.4343836 |
|
 Justin Upton
 |
Upton Justin |
LF |
$14,708,333 |
14708333 |
13.57% |
13.57 |
3.59 |
3.59486 |
0.24 |
0.24440975058152 |
$4,091,490 |
4091489.7937611 |
|
 James Shields
 |
Shields James |
RP |
$10,000,000 |
10000000 |
9.23% |
9.23 |
2.62 |
2.62383 |
0.26 |
0.262383 |
$3,811,223 |
3811222.5258496 |
|
 Ian Kennedy
 |
Kennedy Ian |
RP |
$9,850,000 |
9850000 |
9.09% |
9.09 |
0.28 |
0.278317 |
0.03 |
0.028255532994924 |
$35,391,298 |
35391298.411524 |
|
 Craig Kimbrel
 |
Kimbrel Craig |
RP |
$9,250,000 |
9250000 |
8.53% |
8.53 |
1.85 |
1.84832 |
0.20 |
0.19981837837838 |
$5,004,545 |
5004544.66759 |
|
 Joaquin Benoit
 |
Benoit Joaquin |
RP |
$8,000,000 |
8000000 |
7.38% |
7.38 |
1.31 |
1.3113 |
0.16 |
0.1639125 |
$6,100,816 |
6100815.9841379 |
|
 Cory Luebke
 |
Luebke Cory |
DNP |
$5,375,000 |
5375000 |
4.96% |
4.96 |
— |
0.00 |
— |
0 |
— |
0 |
|
 Tyson Ross
 |
Ross Tyson |
RP |
$5,250,000 |
5250000 |
4.84% |
4.84 |
5.31 |
5.30962 |
1.01 |
1.0113561904762 |
$988,771 |
988771.32450157 |
|
 Will Venable
 |
Venable Will |
CF |
$4,250,000 |
4250000 |
3.92% |
3.92 |
0.15 |
0.154387 |
0.04 |
0.036326352941176 |
$27,528,225 |
27528224.526676 |
|
 Andrew Cashner
 |
Cashner Andrew |
RP |
$4,050,000 |
4050000 |
3.74% |
3.74 |
2.05 |
2.05113 |
0.51 |
0.50645185185185 |
$1,974,521 |
1974521.3613959 |
|
 Matt Kemp
 |
Kemp Matt |
RF |
$3,250,000 |
3250000 |
3.00% |
3.00 |
3.06 |
3.06167 |
0.94 |
0.94205230769231 |
$1,061,512 |
1061512.1812606 |
|
 Shawn Kelley
 |
Kelley Shawn |
RP |
$2,835,000 |
2835000 |
2.62% |
2.62 |
1.07 |
1.07292 |
0.38 |
0.37845502645503 |
$2,642,322 |
2642321.887932 |
|
 Brandon Morrow
 |
Morrow Brandon |
RP |
$2,500,000 |
2500000 |
2.31% |
2.31 |
0.06 |
0.064102 |
0.03 |
0.0256408 |
$39,000,343 |
39000343.20302 |
|
 Jedd Gyorko
 |
Gyorko Jedd |
2B |
$2,000,000 |
2000000 |
1.85% |
1.85 |
0.86 |
0.864743 |
0.43 |
0.4323715 |
$2,312,826 |
2312825.8916233 |
|
 Yonder Alonso
 |
Alonso Yonder |
1B |
$1,650,000 |
1650000 |
1.52% |
1.52 |
1.23 |
1.22552 |
0.74 |
0.74273939393939 |
$1,346,367 |
1346367.2563483 |
|
 Dale Thayer
 |
Thayer Dale |
RP |
$1,375,000 |
1375000 |
1.27% |
1.27 |
-0.31 |
-0.313393 |
— |
0 |
— |
0 |
|
 Clint Barmes
 |
Barmes Clint |
SS |
$1,300,000 |
1300000 |
1.20% |
1.20 |
0.74 |
0.741945 |
0.57 |
0.57072692307692 |
$1,752,151 |
1752151.4397968 |
|
 Alexi Amarista
 |
Amarista Alexi |
SS |
$1,150,000 |
1150000 |
1.06% |
1.06 |
-0.16 |
-0.157224 |
— |
0 |
— |
0 |
|
 Josh Johnson
 |
Johnson Josh |
DNP |
$1,000,000 |
1000000 |
0.92% |
0.92 |
— |
0.00 |
— |
0 |
— |
0 |
|
 Wil Nieves
 |
Nieves Wil |
C |
$850,000 |
850000 |
0.78% |
0.78 |
-0.17 |
-0.170175 |
— |
0 |
— |
0 |
|
 Derek Norris
 |
Norris Derek |
C |
$545,000 |
545000 |
0.50% |
0.50 |
4.02 |
4.01686 |
7.37 |
7.3703853211009 |
$135,678 |
135678.11673795 |
|
 Will Middlebrooks
 |
Middlebrooks Will |
3B |
$540,500 |
540500 |
0.50% |
0.50 |
-0.39 |
-0.39291 |
— |
0 |
— |
0 |
|
 Nick Vincent
 |
Vincent Nick |
RP |
$525,300 |
525300 |
0.48% |
0.48 |
0.28 |
0.283388 |
0.54 |
0.53947839329907 |
$1,853,642 |
1853642.3560631 |
|
 Wil Myers
 |
Myers Wil |
CF |
$519,800 |
519800 |
0.48% |
0.48 |
0.94 |
0.943304 |
1.81 |
1.8147441323586 |
$551,042 |
551041.8698532 |
|
 Odrisamer Despaigne
 |
Despaigne Odrisamer |
RP |
$517,300 |
517300 |
0.48% |
0.48 |
-0.68 |
-0.683806 |
— |
0 |
— |
0 |
|
 Yangervis Solarte
 |
Solarte Yangervis |
3B |
$516,400 |
516400 |
0.48% |
0.48 |
1.62 |
1.62251 |
3.14 |
3.1419635941131 |
$318,272 |
318272.3064881 |
|
 Tim Federowicz
 |
Federowicz Tim |
DNP |
$512,400 |
512400 |
0.47% |
0.47 |
— |
0.00 |
— |
0 |
— |
0 |
|
 Frank Garces
 |
Garces Frank |
RP |
$508,500 |
508500 |
0.47% |
0.47 |
-0.69 |
-0.68909 |
— |
0 |
— |
0 |
|
 Cory Spangenberg
 |
Spangenberg Cory |
2B |
$508,500 |
508500 |
0.47% |
0.47 |
1.26 |
1.26289 |
2.48 |
2.4835594886922 |
$402,648 |
402647.89490771 |
|
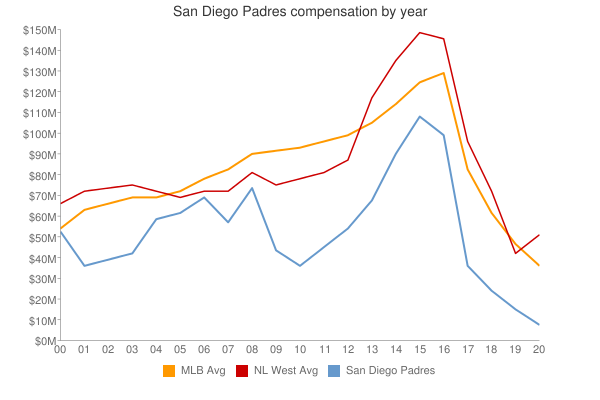
| Year | Padres payroll |
PR Sort |
Avg payroll |
AvgPR Sort |
Diff |
Diff Sort |
|---|
| 1996 | $2,000,000 | 2000000 | $4,583,416 | 4583416 | $-2,583,416 | -2583416 |
| 1997 | $2,000,000 | 2000000 | $4,892,222 | 4892222 | $-2,892,222 | -2892222 |
| 2000 | $53,816,000 | 53816000 | $57,491,092 | 57491092 | $-3,675,092 | -3675092 |
| 2001 | $37,438,000 | 37438000 | $67,120,750 | 67120750 | $-29,682,750 | -29682750 |
| 2002 | $40,678,000 | 40678000 | $69,204,705 | 69204705 | $-28,526,705 | -28526705 |
| 2003 | $43,565,000 | 43565000 | $72,156,639 | 72156639 | $-28,591,639 | -28591639 |
| 2004 | $59,172,333 | 59172333 | $71,426,357 | 71426357 | $-12,254,024 | -12254024 |
| 2005 | $62,186,333 | 62186333 | $73,628,169 | 73628169 | $-11,441,836 | -11441836 |
| 2006 | $69,170,167 | 69170167 | $81,192,832 | 81192832 | $-12,022,665 | -12022665 |
| 2007 | $58,571,067 | 58571067 | $85,747,487 | 85747487 | $-27,176,420 | -27176420 |
| 2008 | $74,010,117 | 74010117 | $93,079,041 | 93079041 | $-19,068,924 | -19068924 |
| 2009 | $44,173,200 | 44173200 | $92,957,049 | 92957049 | $-48,783,849 | -48783849 |
| 2010 | $37,799,300 | 37799300 | $94,957,956 | 94957956 | $-57,158,656 | -57158656 |
| 2011 | $45,869,140 | 45869140 | $97,426,414 | 97426414 | $-51,557,274 | -51557274 |
| 2012 | $55,621,900 | 55621900 | $100,689,500 | 100689500 | $-45,067,600 | -45067600 |
| 2013 | $68,333,600 | 68333600 | $106,658,387 | 106658387 | $-38,324,787 | -38324787 |
| 2014 | $90,636,600 | 90636600 | $115,428,670 | 115428670 | $-24,792,070 | -24792070 |
| 2015 | $108,387,033 | 108387033 | $125,458,486 | 125458486 | $-17,071,453 | -17071453 |
| 2016 | $100,509,500 | 100509500 | $130,290,910 | 130290910 | $-29,781,410 | -29781410 |
| 2017 | $67,624,400 | 67624400 | $136,573,000 | 136573000 | $-68,948,600 | -68948600 |
| 2018 | $94,037,733 | 94037733 | $135,681,867 | 135681867 | $-41,644,134 | -41644134 |
| 2019 | $100,804,100 | 100804100 | $134,776,225 | 134776225 | $-33,972,125 | -33972125 |
| 2020 | $151,461,550 | 151461550 | $138,321,485 | 138321485 | $13,140,065 | 13140065 |
| 2021 | $171,488,220 | 171488220 | $129,635,938 | 129635938 | $41,852,282 | 41852282 |
| 2022 | $212,846,719 | 212846719 | $147,002,411 | 147002411 | $65,844,308 | 65844308 |
| 2023 | $221,599,740 | 221599740 | $158,155,877 | 158155877 | $63,443,863 | 63443863 |
| 2024 | $153,892,054 | 153892054 | $133,074,721 | 133074721 | $20,817,333 | 20817333 |
| 2025 | $150,295,454 | 150295454 | $94,180,059 | 94180059 | $56,115,395 | 56115395 |
| 2026 | $137,745,454 | 137745454 | $74,818,461 | 74818461 | $62,926,993 | 62926993 |
| 2027 | $156,495,454 | 156495454 | $56,972,319 | 56972319 | $99,523,135 | 99523135 |
| 2028 | $124,545,454 | 124545454 | $45,437,759 | 45437759 | $79,107,695 | 79107695 |
| 2029 | $113,545,454 | 113545454 | $37,269,628 | 37269628 | $76,275,826 | 76275826 |
| 2030 | $113,545,454 | 113545454 | $39,665,769 | 39665769 | $73,879,685 | 73879685 |
| 2031 | $101,259,739 | 101259739 | $38,360,152 | 38360152 | $62,899,587 | 62899587 |
| 2032 | $101,259,739 | 101259739 | $47,925,459 | 47925459 | $53,334,280 | 53334280 |
| 2033 | $101,259,739 | 101259739 | $43,068,924 | 43068924 | $58,190,815 | 58190815 |
| 2034 | $36,714,285 | 36714285 | $29,428,571 | 29428571 | $7,285,714 | 7285714 |
|
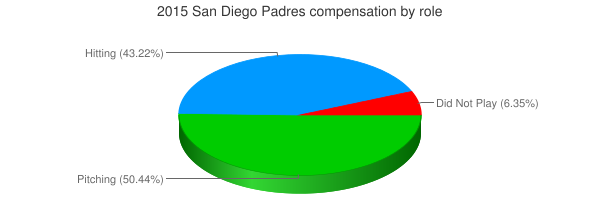
 2015 San Diego Padres