| Player | Player Sort | Pos | Salary | Salary Sort | Pct | Pct Sort | WARP | WARP Sort | WARP/$M | WARP/$M Sort | $/WARP | $/WARP Sort | Current Status |
|---|
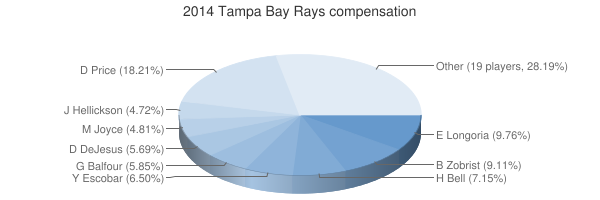
 David Price
 |
Price David |
RP |
$14,000,000 |
14000000 |
18.21% |
18.21 |
5.60 |
5.59906 |
0.40 |
0.39993285714286 |
$2,500,420 |
2500419.713309 |
|
 Evan Longoria
 |
Longoria Evan |
3B |
$7,500,000 |
7500000 |
9.76% |
9.76 |
4.75 |
4.74964 |
0.63 |
0.63328533333333 |
$1,579,067 |
1579067.0450813 |
|
 Ben Zobrist
 |
Zobrist Ben |
2B |
$7,000,000 |
7000000 |
9.11% |
9.11 |
4.85 |
4.84809 |
0.69 |
0.69258428571429 |
$1,443,868 |
1443867.5849665 |
|
 Heath Bell
 |
Bell Heath |
RP |
$5,500,000 |
5500000 |
7.15% |
7.15 |
-0.12 |
-0.115266 |
— |
0 |
— |
0 |
|
 Yunel Escobar
 |
Escobar Yunel |
SS |
$5,000,000 |
5000000 |
6.50% |
6.50 |
0.78 |
0.782934 |
0.16 |
0.1565868 |
$6,386,234 |
6386234.3441465 |
|
 Grant Balfour
 |
Balfour Grant |
RP |
$4,500,000 |
4500000 |
5.85% |
5.85 |
0.37 |
0.374891 |
0.08 |
0.083309111111111 |
$12,003,489 |
12003489.01414 |
|
 David DeJesus
 |
DeJesus David |
DH |
$4,375,000 |
4375000 |
5.69% |
5.69 |
1.00 |
1.00397 |
0.23 |
0.22947885714286 |
$4,357,700 |
4357699.9312728 |
|
 Matt Joyce
 |
Joyce Matt |
LF |
$3,700,000 |
3700000 |
4.81% |
4.81 |
1.99 |
1.99324 |
0.54 |
0.53871351351351 |
$1,856,274 |
1856274.206819 |
|
 Jeremy Hellickson
 |
Hellickson Jeremy |
RP |
$3,625,000 |
3625000 |
4.72% |
4.72 |
1.12 |
1.12068 |
0.31 |
0.30915310344828 |
$3,234,643 |
3234643.2523111 |
|
 Joel Peralta
 |
Peralta Joel |
RP |
$3,000,000 |
3000000 |
3.90% |
3.90 |
1.42 |
1.42185 |
0.47 |
0.47395 |
$2,109,927 |
2109927.2075113 |
|
 Ryan Hanigan
 |
Hanigan Ryan |
C |
$2,750,000 |
2750000 |
3.58% |
3.58 |
1.64 |
1.643 |
0.60 |
0.59745454545455 |
$1,673,767 |
1673767.4984784 |
|
 James Loney
 |
Loney James |
1B |
$2,666,666 |
2666666 |
3.47% |
3.47 |
0.43 |
0.430454 |
0.16 |
0.16142029035507 |
$6,195,008 |
6195008.0612563 |
|
 José Molina
 |
Molina Jose |
C |
$1,750,000 |
1750000 |
2.28% |
2.28 |
-0.19 |
-0.187519 |
— |
0 |
— |
0 |
|
 Juan Carlos Oviedo
 |
Oviedo Juan Carlos |
RP |
$1,500,000 |
1500000 |
1.95% |
1.95 |
0.01 |
0.00982088 |
0.01 |
0.0065472533333333 |
$152,735,804 |
152735803.71616 |
|
 Sean Rodríguez
 |
Rodriguez Sean |
2B |
$1,475,000 |
1475000 |
1.92% |
1.92 |
0.17 |
0.174238 |
0.12 |
0.11812745762712 |
$8,465,432 |
8465432.3396733 |
|
 Jake McGee
 |
McGee Jake |
RP |
$1,450,000 |
1450000 |
1.89% |
1.89 |
1.71 |
1.71265 |
1.18 |
1.1811379310345 |
$846,641 |
846641.17011649 |
|
 Matt Moore
 |
Moore Matt |
RP |
$1,100,000 |
1100000 |
1.43% |
1.43 |
-0.17 |
-0.166571 |
— |
0 |
— |
0 |
|
 César Ramos
 |
Ramos Cesar |
RP |
$749,750 |
749750 |
0.98% |
0.98 |
-0.16 |
-0.163618 |
— |
0 |
— |
0 |
|
 Chris Archer
 |
Archer Chris |
RP |
$666,667 |
666667 |
0.87% |
0.87 |
2.49 |
2.49346 |
3.74 |
3.7401881299059 |
$267,366 |
267366.23005783 |
|
 Desmond Jennings
 |
Jennings Desmond |
CF |
$517,000 |
517000 |
0.67% |
0.67 |
1.95 |
1.94566 |
3.76 |
3.7633655705996 |
$265,720 |
265719.60157479 |
|
 Alex Cobb
 |
Cobb Alex |
RP |
$516,900 |
516900 |
0.67% |
0.67 |
4.16 |
4.15875 |
8.05 |
8.045560069646 |
$124,292 |
124292.15509468 |
|
 Logan Forsythe
 |
Forsythe Logan |
2B |
$509,700 |
509700 |
0.66% |
0.66 |
0.45 |
0.453782 |
0.89 |
0.89029232882088 |
$1,123,227 |
1123226.5713492 |
|
 Brandon Gomes
 |
Gomes Brandon |
RP |
$507,800 |
507800 |
0.66% |
0.66 |
0.48 |
0.478347 |
0.94 |
0.94199881843245 |
$1,061,572 |
1061572.4568148 |
|
 Josh Lueke
 |
Lueke Josh |
RP |
$504,200 |
504200 |
0.66% |
0.66 |
0.07 |
0.0654322 |
0.13 |
0.12977429591432 |
$7,705,686 |
7705686.1912025 |
|
 Wil Myers
 |
Myers Wil |
RF |
$504,200 |
504200 |
0.66% |
0.66 |
-0.22 |
-0.219388 |
— |
0 |
— |
0 |
|
 Jake Odorizzi
 |
Odorizzi Jake |
RP |
$503,100 |
503100 |
0.65% |
0.65 |
1.67 |
1.6744 |
3.33 |
3.328165374677 |
$300,466 |
300465.83850932 |
|
 Brandon Guyer
 |
Guyer Brandon |
LF |
$501,200 |
501200 |
0.65% |
0.65 |
1.55 |
1.54657 |
3.09 |
3.0857342378292 |
$324,072 |
324071.9786366 |
|
 Tim Beckham
 |
Beckham Tim |
DNP |
$500,200 |
500200 |
0.65% |
0.65 |
— |
0.00 |
— |
0 |
— |
0 |
|
| Year | Rays payroll |
PR Sort |
Avg payroll |
AvgPR Sort |
Diff |
Diff Sort |
|---|
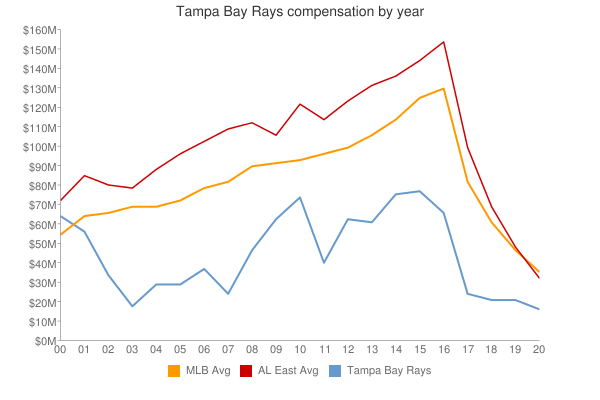
| 2000 | $62,815,129 | 62815129 | $57,491,092 | 57491092 | $5,324,037 | 5324037 |
| 2001 | $56,725,000 | 56725000 | $67,120,750 | 67120750 | $-10,395,750 | -10395750 |
| 2002 | $34,380,000 | 34380000 | $69,204,705 | 69204705 | $-34,824,705 | -34824705 |
| 2003 | $19,130,000 | 19130000 | $72,156,639 | 72156639 | $-53,026,639 | -53026639 |
| 2004 | $29,754,167 | 29754167 | $71,426,357 | 71426357 | $-41,672,190 | -41672190 |
| 2005 | $30,445,567 | 30445567 | $73,628,169 | 73628169 | $-43,182,602 | -43182602 |
| 2006 | $38,319,967 | 38319967 | $81,192,832 | 81192832 | $-42,872,865 | -42872865 |
| 2007 | $25,790,800 | 25790800 | $85,747,487 | 85747487 | $-59,956,687 | -59956687 |
| 2008 | $47,124,500 | 47124500 | $93,079,041 | 93079041 | $-45,954,541 | -45954541 |
| 2009 | $65,401,368 | 65401368 | $92,957,049 | 92957049 | $-27,555,681 | -27555681 |
| 2010 | $74,487,608 | 74487608 | $94,957,956 | 94957956 | $-20,470,348 | -20470348 |
| 2011 | $41,901,308 | 41901308 | $97,426,414 | 97426414 | $-55,525,106 | -55525106 |
| 2012 | $63,626,675 | 63626675 | $100,689,500 | 100689500 | $-37,062,825 | -37062825 |
| 2013 | $61,928,975 | 61928975 | $106,658,387 | 106658387 | $-44,729,412 | -44729412 |
| 2014 | $76,872,383 | 76872383 | $115,428,670 | 115428670 | $-38,556,287 | -38556287 |
| 2015 | $77,294,234 | 77294234 | $125,458,486 | 125458486 | $-48,164,252 | -48164252 |
| 2016 | $66,681,991 | 66681991 | $130,290,910 | 130290910 | $-63,608,919 | -63608919 |
| 2017 | $70,612,800 | 70612800 | $136,573,000 | 136573000 | $-65,960,200 | -65960200 |
| 2018 | $76,007,496 | 76007496 | $135,681,867 | 135681867 | $-59,674,371 | -59674371 |
| 2019 | $60,084,133 | 60084133 | $134,776,225 | 134776225 | $-74,692,092 | -74692092 |
| 2020 | $69,303,833 | 69303833 | $138,321,485 | 138321485 | $-69,017,652 | -69017652 |
| 2021 | $63,714,834 | 63714834 | $129,635,938 | 129635938 | $-65,921,104 | -65921104 |
| 2022 | $85,728,178 | 85728178 | $147,002,411 | 147002411 | $-61,274,233 | -61274233 |
| 2023 | $73,184,811 | 73184811 | $158,155,877 | 158155877 | $-84,971,066 | -84971066 |
| 2024 | $56,128,512 | 56128512 | $133,074,721 | 133074721 | $-76,946,209 | -76946209 |
| 2025 | $51,971,212 | 51971212 | $94,180,059 | 94180059 | $-42,208,847 | -42208847 |
| 2026 | $26,954,545 | 26954545 | $74,818,461 | 74818461 | $-47,863,916 | -47863916 |
| 2027 | $23,204,545 | 23204545 | $56,972,319 | 56972319 | $-33,767,774 | -33767774 |
| 2028 | $25,454,546 | 25454546 | $45,437,759 | 45437759 | $-19,983,213 | -19983213 |
| 2029 | $25,454,546 | 25454546 | $37,269,628 | 37269628 | $-11,815,082 | -11815082 |
| 2030 | $25,454,546 | 25454546 | $39,665,769 | 39665769 | $-14,211,223 | -14211223 |
| 2031 | $25,454,546 | 25454546 | $38,360,152 | 38360152 | $-12,905,606 | -12905606 |
| 2032 | $25,454,546 | 25454546 | $47,925,459 | 47925459 | $-22,470,913 | -22470913 |
| 2033 | $2,000,000 | 2000000 | $43,068,924 | 43068924 | $-41,068,924 | -41068924 |
|
 2014 Tampa Bay Rays


