| Player | Player Sort | Pos | Salary | Salary Sort | Pct | Pct Sort | WARP | WARP Sort | WARP/$M | WARP/$M Sort | $/WARP | $/WARP Sort | Current Status |
|---|
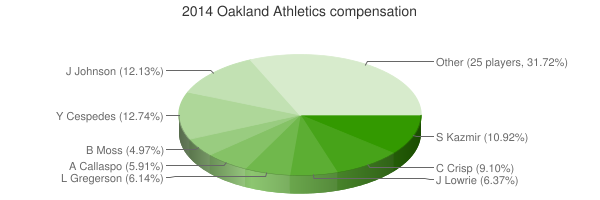
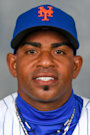 Yoenis Céspedes
 |
Cespedes Yoenis |
LF |
$10,500,000 |
10500000 |
12.74% |
12.74 |
3.28 |
3.28235 |
0.31 |
0.31260476190476 |
$3,198,928 |
3198927.5976054 |
|
 Jim Johnson
 |
Johnson Jim |
RP |
$10,000,000 |
10000000 |
12.13% |
12.13 |
-1.37 |
-1.37304 |
— |
0 |
— |
0 |
|
 Scott Kazmir
 |
Kazmir Scott |
RP |
$9,000,000 |
9000000 |
10.92% |
10.92 |
3.52 |
3.51941 |
0.39 |
0.39104555555556 |
$2,557,247 |
2557246.8112553 |
|
 Coco Crisp
 |
Crisp Coco |
CF |
$7,500,000 |
7500000 |
9.10% |
9.10 |
0.89 |
0.891445 |
0.12 |
0.11885933333333 |
$8,413,306 |
8413306.4855375 |
|
 Jed Lowrie
 |
Lowrie Jed |
SS |
$5,250,000 |
5250000 |
6.37% |
6.37 |
1.37 |
1.36995 |
0.26 |
0.26094285714286 |
$3,832,257 |
3832256.6517026 |
|
 Luke Gregerson
 |
Gregerson Luke |
RP |
$5,065,000 |
5065000 |
6.14% |
6.14 |
1.30 |
1.30076 |
0.26 |
0.2568134254689 |
$3,893,877 |
3893877.4255051 |
|
 Alberto Callaspo
 |
Callaspo Alberto |
2B |
$4,875,000 |
4875000 |
5.91% |
5.91 |
-0.53 |
-0.52627 |
— |
0 |
— |
0 |
|
 Brandon Moss
 |
Moss Brandon |
1B |
$4,100,000 |
4100000 |
4.97% |
4.97 |
2.77 |
2.77263 |
0.68 |
0.6762512195122 |
$1,478,740 |
1478740.4017125 |
|
 Hiroyuki Nakajima
 |
Nakajima Hiroyuki |
DNP |
$3,125,000 |
3125000 |
3.79% |
3.79 |
— |
0.00 |
— |
0 |
— |
0 |
|
 Nick Punto
 |
Punto Nick |
2B |
$2,750,000 |
2750000 |
3.34% |
3.34 |
0.44 |
0.439051 |
0.16 |
0.15965490909091 |
$6,263,509 |
6263509.2506338 |
|
 Josh Reddick
 |
Reddick Josh |
RF |
$2,700,000 |
2700000 |
3.27% |
3.27 |
2.61 |
2.61242 |
0.97 |
0.96756296296296 |
$1,033,524 |
1033524.4715628 |
|
 John Jaso
 |
Jaso John |
C |
$2,300,000 |
2300000 |
2.79% |
2.79 |
0.87 |
0.869989 |
0.38 |
0.37825608695652 |
$2,643,712 |
2643711.587158 |
|
 Brett Anderson
 |
Anderson Brett |
DNP |
$2,000,000 |
2000000 |
2.43% |
2.43 |
— |
0.00 |
— |
0 |
— |
0 |
|
 Eric O'Flaherty
 |
O'Flaherty Eric |
RP |
$1,500,000 |
1500000 |
1.82% |
1.82 |
0.29 |
0.285302 |
0.19 |
0.19020133333333 |
$5,257,587 |
5257586.6976046 |
|
 Daric Barton
 |
Barton Daric |
1B |
$1,250,000 |
1250000 |
1.52% |
1.52 |
-0.48 |
-0.477463 |
— |
0 |
— |
0 |
|
 Craig Gentry
 |
Gentry Craig |
CF |
$1,145,000 |
1145000 |
1.39% |
1.39 |
1.40 |
1.39921 |
1.22 |
1.2220174672489 |
$818,319 |
818318.90852695 |
|
 Sam Fuld
 |
Fuld Sam |
LF |
$800,000 |
800000 |
0.97% |
0.97 |
0.98 |
0.98053 |
1.23 |
1.2256625 |
$815,885 |
815885.28652871 |
|
 Jesse Chavez
 |
Chavez Jesse |
RP |
$775,000 |
775000 |
0.94% |
0.94 |
1.66 |
1.65539 |
2.14 |
2.1359870967742 |
$468,168 |
468167.62213134 |
|
 Sean Doolittle
 |
Doolittle Sean |
RP |
$630,000 |
630000 |
0.76% |
0.76 |
1.53 |
1.52659 |
2.42 |
2.4231587301587 |
$412,684 |
412684.47978829 |
|
 Fernando Rodriguez Jr.
 |
Rodriguez Jr. Fernando |
RP |
$600,000 |
600000 |
0.73% |
0.73 |
-0.02 |
-0.0189401 |
— |
0 |
— |
0 |
|
 Fernando Abad
 |
Abad Fernando |
RP |
$525,900 |
525900 |
0.64% |
0.64 |
0.73 |
0.729104 |
1.39 |
1.3863928503518 |
$721,296 |
721296.27597709 |
|
 Tommy Milone
 |
Milone Tommy |
RP |
$510,000 |
510000 |
0.62% |
0.62 |
-0.76 |
-0.75859 |
— |
0 |
— |
0 |
|
 Eric Sogard
 |
Sogard Eric |
2B |
$510,000 |
510000 |
0.62% |
0.62 |
0.81 |
0.806321 |
1.58 |
1.5810215686275 |
$632,502 |
632502.4400952 |
|
 Evan Scribner
 |
Scribner Evan |
RP |
$505,000 |
505000 |
0.61% |
0.61 |
0.22 |
0.220239 |
0.44 |
0.43611683168317 |
$2,292,964 |
2292963.5532308 |
|
 A.J. Griffin
 |
Griffin A.J. |
DNP |
$505,000 |
505000 |
0.61% |
0.61 |
— |
0.00 |
— |
0 |
— |
0 |
|
 Ryan Cook
 |
Cook Ryan |
RP |
$505,000 |
505000 |
0.61% |
0.61 |
0.27 |
0.266515 |
0.53 |
0.52775247524752 |
$1,894,828 |
1894827.6832448 |
|
 Derek Norris
 |
Norris Derek |
C |
$505,000 |
505000 |
0.61% |
0.61 |
1.90 |
1.89651 |
3.76 |
3.7554653465347 |
$266,279 |
266278.58540161 |
|
 Drew Pomeranz
 |
Pomeranz Drew |
RP |
$505,000 |
505000 |
0.61% |
0.61 |
0.55 |
0.545872 |
1.08 |
1.0809346534653 |
$925,125 |
925125.30410059 |
|
 Dan Straily
 |
Straily Dan |
RP |
$505,000 |
505000 |
0.61% |
0.61 |
-0.16 |
-0.164023 |
— |
0 |
— |
0 |
|
 Sonny Gray
 |
Gray Sonny |
RP |
$502,500 |
502500 |
0.61% |
0.61 |
3.81 |
3.81081 |
7.58 |
7.5837014925373 |
$131,862 |
131861.73018335 |
|
 Dan Otero
 |
Otero Dan |
RP |
$502,500 |
502500 |
0.61% |
0.61 |
0.94 |
0.938694 |
1.87 |
1.868047761194 |
$535,318 |
535318.21871664 |
|
 Josh Donaldson
 |
Donaldson Josh |
3B |
$500,000 |
500000 |
0.61% |
0.61 |
7.16 |
7.1594 |
14.32 |
14.3188 |
$69,838 |
69838.254602341 |
|
 Jarrod Parker
 |
Parker Jarrod |
DNP |
$500,000 |
500000 |
0.61% |
0.61 |
— |
0.00 |
— |
0 |
— |
0 |
|
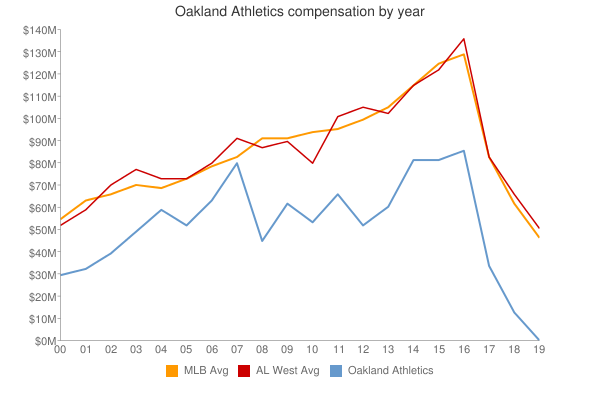
| Year | Athletics payroll |
PR Sort |
Avg payroll |
AvgPR Sort |
Diff |
Diff Sort |
|---|
| 1979 | $21,000 | 21000 | $48,000 | 48000 | $-27,000 | -27000 |
| 1981 | $185,000 | 185000 | $92,500 | 92500 | $92,500 | 92500 |
| 1982 | $535,000 | 535000 | $267,500 | 267500 | $267,500 | 267500 |
| 1983 | $800,000 | 800000 | $400,000 | 400000 | $400,000 | 400000 |
| 1984 | $950,000 | 950000 | $260,000 | 260000 | $690,000 | 690000 |
| 1987 | $72,500 | 72500 | $589,500 | 589500 | $-517,000 | -517000 |
| 1988 | $250,000 | 250000 | $732,083 | 732083 | $-482,083 | -482083 |
| 1989 | $455,000 | 455000 | $862,714 | 862714 | $-407,714 | -407714 |
| 1990 | $3,750,000 | 3750000 | $1,203,571 | 1203571 | $2,546,429 | 2546429 |
| 1991 | $6,100,000 | 6100000 | $1,884,642 | 1884642 | $4,215,358 | 4215358 |
| 1992 | $5,950,000 | 5950000 | $2,356,071 | 2356071 | $3,593,929 | 3593929 |
| 1993 | $7,250,000 | 7250000 | $3,410,000 | 3410000 | $3,840,000 | 3840000 |
| 1994 | $7,800,000 | 7800000 | $3,911,904 | 3911904 | $3,888,096 | 3888096 |
| 1995 | $10,700,000 | 10700000 | $5,208,333 | 5208333 | $5,491,667 | 5491667 |
| 1996 | $7,000,000 | 7000000 | $4,583,416 | 4583416 | $2,416,584 | 2416584 |
| 1997 | $7,100,000 | 7100000 | $4,892,222 | 4892222 | $2,207,778 | 2207778 |
| 1998 | $9,433,333 | 9433333 | $6,661,904 | 6661904 | $2,771,429 | 2771429 |
| 1999 | $8,833,333 | 8833333 | $7,867,823 | 7867823 | $965,510 | 965510 |
| 2000 | $30,906,333 | 30906333 | $57,491,092 | 57491092 | $-26,584,759 | -26584759 |
| 2001 | $33,404,750 | 33404750 | $67,120,750 | 67120750 | $-33,716,000 | -33716000 |
| 2002 | $40,004,167 | 40004167 | $69,204,705 | 69204705 | $-29,200,538 | -29200538 |
| 2003 | $49,644,266 | 49644266 | $72,156,639 | 72156639 | $-22,512,373 | -22512373 |
| 2004 | $59,150,667 | 59150667 | $71,426,357 | 71426357 | $-12,275,690 | -12275690 |
| 2005 | $53,960,500 | 53960500 | $73,628,169 | 73628169 | $-19,667,669 | -19667669 |
| 2006 | $64,615,625 | 64615625 | $81,192,832 | 81192832 | $-16,577,207 | -16577207 |
| 2007 | $80,777,050 | 80777050 | $85,747,487 | 85747487 | $-4,970,437 | -4970437 |
| 2008 | $46,325,000 | 46325000 | $93,079,041 | 93079041 | $-46,754,041 | -46754041 |
| 2009 | $62,434,450 | 62434450 | $92,957,049 | 92957049 | $-30,522,599 | -30522599 |
| 2010 | $54,457,400 | 54457400 | $94,957,956 | 94957956 | $-40,500,556 | -40500556 |
| 2011 | $67,354,000 | 67354000 | $97,426,414 | 97426414 | $-30,072,414 | -30072414 |
| 2012 | $53,957,500 | 53957500 | $100,689,500 | 100689500 | $-46,732,000 | -46732000 |
| 2013 | $61,964,500 | 61964500 | $106,658,387 | 106658387 | $-44,693,887 | -44693887 |
| 2014 | $82,445,900 | 82445900 | $115,428,670 | 115428670 | $-32,982,770 | -32982770 |
| 2015 | $82,389,167 | 82389167 | $125,458,486 | 125458486 | $-43,069,319 | -43069319 |
| 2016 | $86,806,234 | 86806234 | $130,290,910 | 130290910 | $-43,484,676 | -43484676 |
| 2017 | $81,738,333 | 81738333 | $136,573,000 | 136573000 | $-54,834,667 | -54834667 |
| 2018 | $65,985,833 | 65985833 | $135,681,867 | 135681867 | $-69,696,034 | -69696034 |
| 2019 | $89,135,833 | 89135833 | $134,776,225 | 134776225 | $-45,640,392 | -45640392 |
| 2020 | $96,582,433 | 96582433 | $138,321,485 | 138321485 | $-41,739,052 | -41739052 |
| 2021 | $84,413,334 | 84413334 | $129,635,938 | 129635938 | $-45,222,604 | -45222604 |
| 2022 | $48,943,334 | 48943334 | $147,002,411 | 147002411 | $-98,059,077 | -98059077 |
| 2023 | $56,395,000 | 56395000 | $158,155,877 | 158155877 | $-101,760,877 | -101760877 |
| 2024 | $43,255,000 | 43255000 | $133,074,721 | 133074721 | $-89,819,721 | -89819721 |
| 2025 | $15,000,000 | 15000000 | $94,180,059 | 94180059 | $-79,180,059 | -79180059 |
| 2026 | $15,000,000 | 15000000 | $74,818,461 | 74818461 | $-59,818,461 | -59818461 |
| 2027 | $15,000,000 | 15000000 | $56,972,319 | 56972319 | $-41,972,319 | -41972319 |
| 2028 | $15,000,000 | 15000000 | $45,437,759 | 45437759 | $-30,437,759 | -30437759 |
|
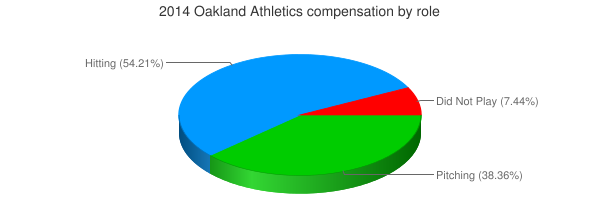
 2014 Oakland Athletics