| Player | Player Sort | Pos | Salary | Salary Sort | Pct | Pct Sort | WARP | WARP Sort | WARP/$M | WARP/$M Sort | $/WARP | $/WARP Sort | Current Status |
|---|
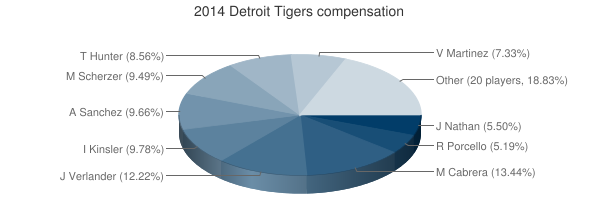
 Miguel Cabrera
 |
Cabrera Miguel |
1B |
$22,000,000 |
22000000 |
13.44% |
13.44 |
5.71 |
5.70551 |
0.26 |
0.25934136363636 |
$3,855,922 |
3855921.7317996 |
|
 Justin Verlander
 |
Verlander Justin |
RP |
$20,000,000 |
20000000 |
12.22% |
12.22 |
-0.94 |
-0.937333 |
— |
0 |
— |
0 |
|
 Ian Kinsler
 |
Kinsler Ian |
2B |
$16,000,000 |
16000000 |
9.78% |
9.78 |
2.55 |
2.55154 |
0.16 |
0.15947125 |
$6,270,723 |
6270722.7791843 |
|
 Aníbal Sánchez
 |
Sanchez Anibal |
RP |
$15,800,000 |
15800000 |
9.66% |
9.66 |
1.90 |
1.90408 |
0.12 |
0.12051139240506 |
$8,297,971 |
8297970.6735011 |
|
 Max Scherzer
 |
Scherzer Max |
RP |
$15,525,000 |
15525000 |
9.49% |
9.49 |
4.69 |
4.68809 |
0.30 |
0.30197037037037 |
$3,311,583 |
3311583.1820635 |
|
 Torii Hunter
 |
Hunter Torii |
RF |
$14,000,000 |
14000000 |
8.56% |
8.56 |
0.73 |
0.731368 |
0.05 |
0.052240571428571 |
$19,142,210 |
19142210.214283 |
|
 Victor Martinez
 |
Martinez Victor |
DH |
$12,000,000 |
12000000 |
7.33% |
7.33 |
4.89 |
4.88667 |
0.41 |
0.4072225 |
$2,455,660 |
2455659.9893179 |
|
 Joe Nathan
 |
Nathan Joe |
RP |
$9,000,000 |
9000000 |
5.50% |
5.50 |
-0.73 |
-0.727651 |
— |
0 |
— |
0 |
|
 Rick Porcello
 |
Porcello Rick |
RP |
$8,500,000 |
8500000 |
5.19% |
5.19 |
0.75 |
0.747989 |
0.09 |
0.087998705882353 |
$11,363,803 |
11363803.478393 |
|
 Austin Jackson
 |
Jackson Austin |
CF |
$6,000,000 |
6000000 |
3.67% |
3.67 |
1.24 |
1.24478 |
0.21 |
0.20746333333333 |
$4,820,129 |
4820128.8581115 |
|
 Rajai Davis
 |
Davis Rajai |
LF |
$5,000,000 |
5000000 |
3.06% |
3.06 |
1.99 |
1.99407 |
0.40 |
0.398814 |
$2,507,435 |
2507434.5434212 |
|
 Alex Avila
 |
Avila Alex |
C |
$4,150,000 |
4150000 |
2.54% |
2.54 |
1.58 |
1.58381 |
0.38 |
0.38164096385542 |
$2,620,264 |
2620263.7942683 |
|
 Joba Chamberlain
 |
Chamberlain Joba |
RP |
$2,500,000 |
2500000 |
1.53% |
1.53 |
0.50 |
0.499976 |
0.20 |
0.1999904 |
$5,000,240 |
5000240.0115206 |
|
 Phil Coke
 |
Coke Phil |
RP |
$1,900,000 |
1900000 |
1.16% |
1.16 |
0.11 |
0.110026 |
0.06 |
0.057908421052632 |
$17,268,646 |
17268645.59286 |
|
 José Iglesias
 |
Iglesias Jose |
DNP |
$1,650,000 |
1650000 |
1.01% |
1.01 |
— |
0.00 |
— |
0 |
— |
0 |
|
 Andy Dirks
 |
Dirks Andy |
DNP |
$1,625,000 |
1625000 |
0.99% |
0.99 |
— |
0.00 |
— |
0 |
— |
0 |
|
 Alex Gonzalez
 |
Gonzalez Alex |
SS |
$1,100,000 |
1100000 |
0.67% |
0.67 |
-0.16 |
-0.163786 |
— |
0 |
— |
0 |
|
 Don Kelly
 |
Kelly Don |
3B |
$1,000,000 |
1000000 |
0.61% |
0.61 |
-0.31 |
-0.305966 |
— |
0 |
— |
0 |
|
 Al Alburquerque
 |
Alburquerque Al |
RP |
$837,500 |
837500 |
0.51% |
0.51 |
0.80 |
0.799155 |
0.95 |
0.95421492537313 |
$1,047,982 |
1047981.9309145 |
|
 Drew Smyly
 |
Smyly Drew |
RP |
$520,000 |
520000 |
0.32% |
0.32 |
0.18 |
0.181363 |
0.35 |
0.348775 |
$2,867,178 |
2867177.9800731 |
|
 Luke Putkonen
 |
Putkonen Luke |
RP |
$510,000 |
510000 |
0.31% |
0.31 |
-0.10 |
-0.10387 |
— |
0 |
— |
0 |
|
 Bruce Rondón
 |
Rondon Bruce |
DNP |
$505,000 |
505000 |
0.31% |
0.31 |
— |
0.00 |
— |
0 |
— |
0 |
|
 Andrew Romine
 |
Romine Andrew |
SS |
$504,000 |
504000 |
0.31% |
0.31 |
0.28 |
0.276027 |
0.55 |
0.54767261904762 |
$1,825,908 |
1825908.3350542 |
|
 Ian Krol
 |
Krol Ian |
RP |
$504,000 |
504000 |
0.31% |
0.31 |
-0.63 |
-0.625197 |
— |
0 |
— |
0 |
|
 Evan Reed
 |
Reed Evan |
RP |
$503,000 |
503000 |
0.31% |
0.31 |
-0.09 |
-0.0935723 |
— |
0 |
— |
0 |
|
 Bryan Holaday
 |
Holaday Bryan |
C |
$502,000 |
502000 |
0.31% |
0.31 |
-1.01 |
-1.00509 |
— |
0 |
— |
0 |
|
 Nick Castellanos
 |
Castellanos Nick |
3B |
$500,000 |
500000 |
0.31% |
0.31 |
1.15 |
1.14745 |
2.29 |
2.2949 |
$435,749 |
435748.83437187 |
|
 Eugenio Suárez
 |
Suarez Eugenio |
SS |
$500,000 |
500000 |
0.31% |
0.31 |
1.00 |
1.00204 |
2.00 |
2.00408 |
$498,982 |
498982.07656381 |
|
 Tyler Collins
 |
Collins Tyler |
PH |
$500,000 |
500000 |
0.31% |
0.31 |
-0.13 |
-0.128084 |
— |
0 |
— |
0 |
|
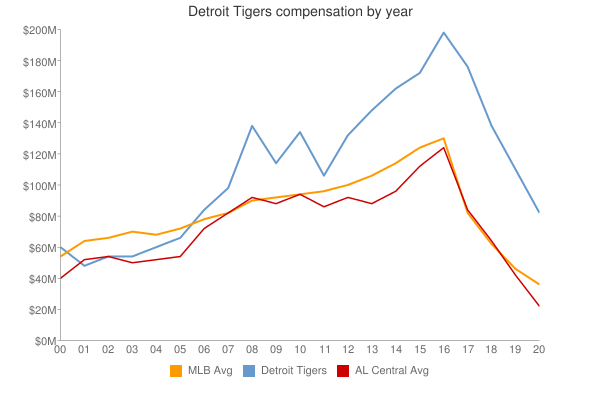
| Year | Tigers payroll |
PR Sort |
Avg payroll |
AvgPR Sort |
Diff |
Diff Sort |
|---|
| 2000 | $60,225,167 | 60225167 | $57,491,092 | 57491092 | $2,734,075 | 2734075 |
| 2001 | $48,524,167 | 48524167 | $67,120,750 | 67120750 | $-18,596,583 | -18596583 |
| 2002 | $54,640,500 | 54640500 | $69,204,705 | 69204705 | $-14,564,205 | -14564205 |
| 2003 | $55,968,000 | 55968000 | $72,156,639 | 72156639 | $-16,188,639 | -16188639 |
| 2004 | $61,141,000 | 61141000 | $71,426,357 | 71426357 | $-10,285,357 | -10285357 |
| 2005 | $67,868,500 | 67868500 | $73,628,169 | 73628169 | $-5,759,669 | -5759669 |
| 2006 | $85,198,456 | 85198456 | $81,192,832 | 81192832 | $4,005,624 | 4005624 |
| 2007 | $97,708,500 | 97708500 | $85,747,487 | 85747487 | $11,961,013 | 11961013 |
| 2008 | $138,175,833 | 138175833 | $93,079,041 | 93079041 | $45,096,792 | 45096792 |
| 2009 | $116,053,000 | 116053000 | $92,957,049 | 92957049 | $23,095,951 | 23095951 |
| 2010 | $134,062,066 | 134062066 | $94,957,956 | 94957956 | $39,104,110 | 39104110 |
| 2011 | $107,019,667 | 107019667 | $97,426,414 | 97426414 | $9,593,253 | 9593253 |
| 2012 | $133,060,667 | 133060667 | $100,689,500 | 100689500 | $32,371,167 | 32371167 |
| 2013 | $148,314,500 | 148314500 | $106,658,387 | 106658387 | $41,656,113 | 41656113 |
| 2014 | $163,635,500 | 163635500 | $115,428,670 | 115428670 | $48,206,830 | 48206830 |
| 2015 | $172,792,250 | 172792250 | $125,458,486 | 125458486 | $47,333,764 | 47333764 |
| 2016 | $198,593,000 | 198593000 | $130,290,910 | 130290910 | $68,302,090 | 68302090 |
| 2017 | $199,750,600 | 199750600 | $136,573,000 | 136573000 | $63,177,600 | 63177600 |
| 2018 | $125,286,000 | 125286000 | $135,681,867 | 135681867 | $-10,395,867 | -10395867 |
| 2019 | $115,673,500 | 115673500 | $134,776,225 | 134776225 | $-19,102,725 | -19102725 |
| 2020 | $103,966,600 | 103966600 | $138,321,485 | 138321485 | $-34,354,885 | -34354885 |
| 2021 | $82,366,200 | 82366200 | $129,635,938 | 129635938 | $-47,269,738 | -47269738 |
| 2022 | $129,413,500 | 129413500 | $147,002,411 | 147002411 | $-17,588,911 | -17588911 |
| 2023 | $122,236,500 | 122236500 | $158,155,877 | 158155877 | $-35,919,377 | -35919377 |
| 2024 | $95,073,933 | 95073933 | $133,074,721 | 133074721 | $-38,000,788 | -38000788 |
| 2025 | $39,593,333 | 39593333 | $94,180,059 | 94180059 | $-54,586,726 | -54586726 |
| 2026 | $28,333,333 | 28333333 | $74,818,461 | 74818461 | $-46,485,128 | -46485128 |
| 2027 | $28,333,333 | 28333333 | $56,972,319 | 56972319 | $-28,638,986 | -28638986 |
| 2028 | $5,333,333 | 5333333 | $45,437,759 | 45437759 | $-40,104,426 | -40104426 |
| 2029 | $5,333,333 | 5333333 | $37,269,628 | 37269628 | $-31,936,295 | -31936295 |
| 2030 | $2,642,500 | 2642500 | $39,665,769 | 39665769 | $-37,023,269 | -37023269 |
|
 2014 Detroit Tigers