| Player | Player Sort | Pos | Salary | Salary Sort | Pct | Pct Sort | WARP | WARP Sort | WARP/$M | WARP/$M Sort | $/WARP | $/WARP Sort | Current Status |
|---|
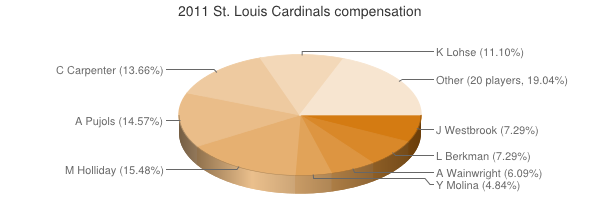
 Matt Holliday
 |
Holliday Matt |
LF |
$17,000,000 |
17000000 |
15.58% |
15.58 |
3.14 |
3.14091 |
0.18 |
0.18475941176471 |
$5,412,444 |
5412444.1642709 |
|
 Albert Pujols
 |
Pujols Albert |
1B |
$16,000,000 |
16000000 |
14.67% |
14.67 |
6.29 |
6.29238 |
0.39 |
0.39327375 |
$2,542,758 |
2542758.0661054 |
|
 Chris Carpenter
 |
Carpenter Chris |
RP |
$15,000,000 |
15000000 |
13.75% |
13.75 |
4.42 |
4.42285 |
0.29 |
0.29485666666667 |
$3,391,478 |
3391478.3454108 |
|
 Kyle Lohse
 |
Lohse Kyle |
RP |
$12,187,500 |
12187500 |
11.17% |
11.17 |
2.64 |
2.63514 |
0.22 |
0.21621661538462 |
$4,624,991 |
4624991.4615542 |
|
 Lance Berkman
 |
Berkman Lance |
RF |
$8,000,000 |
8000000 |
7.33% |
7.33 |
4.76 |
4.76203 |
0.60 |
0.59525375 |
$1,679,956 |
1679955.817162 |
|
 Jake Westbrook
 |
Westbrook Jake |
RP |
$8,000,000 |
8000000 |
7.33% |
7.33 |
0.11 |
0.110347 |
0.01 |
0.013793375 |
$72,498,573 |
72498572.68435 |
|
 Adam Wainwright
 |
Wainwright Adam |
DNP |
$6,687,500 |
6687500 |
6.13% |
6.13 |
— |
0.00 |
— |
0 |
— |
0 |
|
 Yadier Molina
 |
Molina Yadier |
C |
$5,312,500 |
5312500 |
4.87% |
4.87 |
5.44 |
5.44353 |
1.02 |
1.0246644705882 |
$975,929 |
975929.22239797 |
|
 Ryan Theriot
 |
Theriot Ryan |
SS |
$3,300,000 |
3300000 |
3.02% |
3.02 |
0.42 |
0.417247 |
0.13 |
0.12643848484848 |
$7,908,984 |
7908984.3665742 |
|
 Ryan Franklin
 |
Franklin Ryan |
RP |
$3,250,000 |
3250000 |
2.98% |
2.98 |
-0.12 |
-0.120773 |
— |
0 |
— |
0 |
|
 Skip Schumaker
 |
Schumaker Skip |
2B |
$2,700,000 |
2700000 |
2.47% |
2.47 |
0.70 |
0.703334 |
0.26 |
0.26049407407407 |
$3,838,859 |
3838858.9205129 |
|
 Trever Miller
 |
Miller Trever |
RP |
$2,000,000 |
2000000 |
1.83% |
1.83 |
-0.10 |
-0.0988727 |
— |
0 |
— |
0 |
|
 Kyle McClellan
 |
McClellan Kyle |
RP |
$1,375,000 |
1375000 |
1.26% |
1.26 |
-0.77 |
-0.765762 |
— |
0 |
— |
0 |
|
 Gerald Laird
 |
Laird Gerald |
C |
$1,100,000 |
1100000 |
1.01% |
1.01 |
-0.34 |
-0.337264 |
— |
0 |
— |
0 |
|
 Miguel Batista
 |
Batista Miguel |
RP |
$750,000 |
750000 |
0.69% |
0.69 |
-0.48 |
-0.48396 |
— |
0 |
— |
0 |
|
 Nick Punto
 |
Punto Nick |
2B |
$750,000 |
750000 |
0.69% |
0.69 |
1.66 |
1.6585 |
2.21 |
2.2113333333333 |
$452,216 |
452215.85770274 |
|
 Brian Tallet
 |
Tallet Brian |
RP |
$750,000 |
750000 |
0.69% |
0.69 |
-0.15 |
-0.151665 |
— |
0 |
— |
0 |
|
 Zack Cox
 |
Cox Zack |
DNP |
$700,000 |
700000 |
0.64% |
0.64 |
— |
0.00 |
— |
0 |
— |
0 |
|
 Colby Rasmus
 |
Rasmus Colby |
CF |
$443,000 |
443000 |
0.41% |
0.41 |
1.13 |
1.13357 |
2.56 |
2.558848758465 |
$390,801 |
390800.7445504 |
|
 Jaime García
 |
Garcia Jaime |
RP |
$437,000 |
437000 |
0.40% |
0.40 |
2.72 |
2.71827 |
6.22 |
6.2202974828375 |
$160,764 |
160764.015348 |
|
 Jason Motte
 |
Motte Jason |
RP |
$435,000 |
435000 |
0.40% |
0.40 |
1.35 |
1.34671 |
3.10 |
3.0958850574713 |
$323,009 |
323009.40811311 |
|
 Mitchell Boggs
 |
Boggs Mitchell |
RP |
$431,000 |
431000 |
0.40% |
0.40 |
-0.10 |
-0.0959604 |
— |
0 |
— |
0 |
|
 Jon Jay
 |
Jay Jon |
CF |
$416,000 |
416000 |
0.38% |
0.38 |
2.11 |
2.11315 |
5.08 |
5.0796875 |
$196,863 |
196862.50384497 |
|
 David Freese
 |
Freese David |
3B |
$416,000 |
416000 |
0.38% |
0.38 |
1.66 |
1.66222 |
4.00 |
3.9957211538462 |
$250,268 |
250267.71426165 |
|
 Tyler Greene
 |
Greene Tyler |
2B |
$415,500 |
415500 |
0.38% |
0.38 |
0.45 |
0.448985 |
1.08 |
1.0805896510229 |
$925,421 |
925420.67106919 |
|
 Allen Craig
 |
Craig Allen |
LF |
$414,000 |
414000 |
0.38% |
0.38 |
2.19 |
2.18766 |
5.28 |
5.2842028985507 |
$189,243 |
189243.30106141 |
|
 Daniel Descalso
 |
Descalso Daniel |
3B |
$414,000 |
414000 |
0.38% |
0.38 |
0.66 |
0.655712 |
1.58 |
1.583845410628 |
$631,375 |
631374.7498902 |
|
 Bryan Augenstein
 |
Augenstein Bryan |
RP |
$414,000 |
414000 |
0.38% |
0.38 |
0.17 |
0.169651 |
0.41 |
0.40978502415459 |
$2,440,304 |
2440303.9180435 |
|
| Year | Cardinals payroll |
PR Sort |
Avg payroll |
AvgPR Sort |
Diff |
Diff Sort |
|---|
| 1977 | $60,000 | 60000 | $60,000 | 60000 | $0 | 0 |
| 1979 | $75,000 | 75000 | $48,000 | 48000 | $27,000 | 27000 |
| 2000 | $62,093,023 | 62093023 | $56,164,089 | 56164089 | $5,928,934 | 5928934 |
| 2001 | $76,903,333 | 76903333 | $65,991,638 | 65991638 | $10,911,695 | 10911695 |
| 2002 | $74,425,875 | 74425875 | $68,244,471 | 68244471 | $6,181,404 | 6181404 |
| 2003 | $81,365,000 | 81365000 | $71,318,479 | 71318479 | $10,046,521 | 10046521 |
| 2004 | $81,895,000 | 81895000 | $70,466,961 | 70466961 | $11,428,039 | 11428039 |
| 2005 | $90,948,500 | 90948500 | $73,264,780 | 73264780 | $17,683,720 | 17683720 |
| 2006 | $89,093,658 | 89093658 | $79,051,754 | 79051754 | $10,041,904 | 10041904 |
| 2007 | $94,366,000 | 94366000 | $83,931,138 | 83931138 | $10,434,862 | 10434862 |
| 2008 | $99,865,500 | 99865500 | $90,812,373 | 90812373 | $9,053,127 | 9053127 |
| 2009 | $96,298,500 | 96298500 | $91,093,211 | 91093211 | $5,205,289 | 5205289 |
| 2010 | $94,220,500 | 94220500 | $93,373,681 | 93373681 | $846,819 | 846819 |
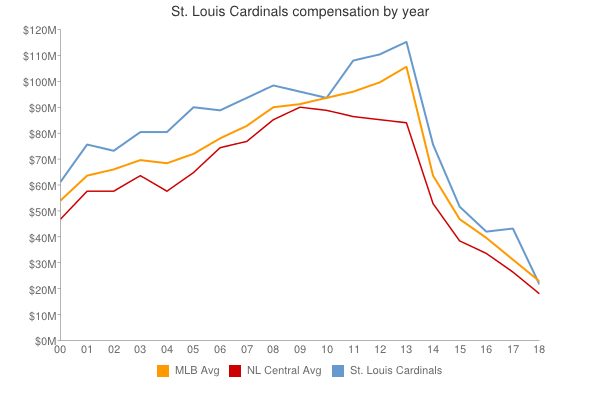
| 2011 | $109,098,000 | 109098000 | $96,102,034 | 96102034 | $12,995,966 | 12995966 |
| 2012 | $111,858,500 | 111858500 | $100,657,138 | 100657138 | $11,201,362 | 11201362 |
| 2013 | $116,505,000 | 116505000 | $109,024,990 | 109024990 | $7,480,010 | 7480010 |
| 2014 | $111,250,000 | 111250000 | $117,828,782 | 117828782 | $-6,578,782 | -6578782 |
| 2015 | $122,066,500 | 122066500 | $127,404,244 | 127404244 | $-5,337,744 | -5337744 |
| 2016 | $145,553,500 | 145553500 | $132,219,407 | 132219407 | $13,334,093 | 13334093 |
| 2017 | $150,152,933 | 150152933 | $137,302,894 | 137302894 | $12,850,039 | 12850039 |
| 2018 | $159,698,667 | 159698667 | $136,929,168 | 136929168 | $22,769,499 | 22769499 |
| 2019 | $162,620,267 | 162620267 | $136,944,257 | 136944257 | $25,676,010 | 25676010 |
| 2020 | $166,101,500 | 166101500 | $140,677,788 | 140677788 | $25,423,712 | 25423712 |
| 2021 | $156,459,167 | 156459167 | $132,162,631 | 132162631 | $24,296,536 | 24296536 |
| 2022 | $140,285,316 | 140285316 | $149,374,046 | 149374046 | $-9,088,730 | -9088730 |
| 2023 | $180,440,183 | 180440183 | $160,460,390 | 160460390 | $19,979,793 | 19979793 |
| 2024 | $155,916,667 | 155916667 | $135,504,022 | 135504022 | $20,412,645 | 20412645 |
| 2025 | $113,906,667 | 113906667 | $96,417,302 | 96417302 | $17,489,365 | 17489365 |
| 2026 | $75,000,000 | 75000000 | $76,694,120 | 76694120 | $-1,694,120 | -1694120 |
| 2027 | $38,500,000 | 38500000 | $58,935,617 | 58935617 | $-20,435,617 | -20435617 |
| 2028 | $5,000,000 | 5000000 | $45,437,759 | 45437759 | $-40,437,759 | -40437759 |
|
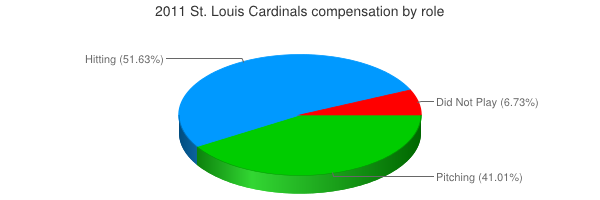
 2011 St. Louis Cardinals