| Player | Player Sort | Pos | Salary | Salary Sort | Pct | Pct Sort | WARP | WARP Sort | WARP/$M | WARP/$M Sort | $/WARP | $/WARP Sort | Current Status |
|---|
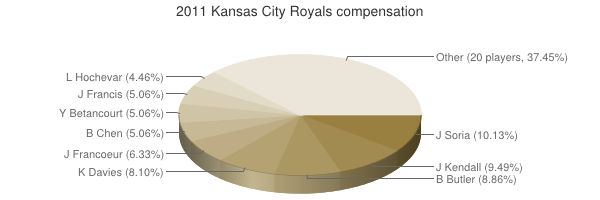
 Joakim Soria
 |
Soria Joakim |
RP |
$4,000,000 |
4000000 |
10.13% |
10.13 |
0.81 |
0.806622 |
0.20 |
0.2016555 |
$4,958,952 |
4958952.2725639 |
|
 Jason Kendall
 |
Kendall Jason |
DNP |
$3,750,000 |
3750000 |
9.49% |
9.49 |
— |
0.00 |
— |
0 |
— |
0 |
|
 Billy Butler
 |
Butler Billy |
DH |
$3,500,000 |
3500000 |
8.86% |
8.86 |
1.53 |
1.53304 |
0.44 |
0.43801142857143 |
$2,283,045 |
2283045.4521735 |
|
 Kyle Davies
 |
Davies Kyle |
RP |
$3,200,000 |
3200000 |
8.10% |
8.10 |
-0.48 |
-0.481221 |
— |
0 |
— |
0 |
|
 Jeff Francoeur
 |
Francoeur Jeff |
RF |
$2,500,000 |
2500000 |
6.33% |
6.33 |
4.19 |
4.19234 |
1.68 |
1.676936 |
$596,326 |
596325.67969201 |
|
 Jeff Francis
 |
Francis Jeff |
RP |
$2,000,000 |
2000000 |
5.06% |
5.06 |
-0.22 |
-0.220767 |
— |
0 |
— |
0 |
|
 Yuniesky Betancourt
 |
Betancourt Yuniesky |
DNP |
$2,000,000 |
2000000 |
5.06% |
5.06 |
— |
0.00 |
— |
0 |
— |
0 |
|
 Bruce Chen
 |
Chen Bruce |
RP |
$2,000,000 |
2000000 |
5.06% |
5.06 |
0.24 |
0.240373 |
0.12 |
0.1201865 |
$8,320,402 |
8320402.0418267 |
|
 Luke Hochevar
 |
Hochevar Luke |
RP |
$1,760,000 |
1760000 |
4.46% |
4.46 |
0.54 |
0.539308 |
0.31 |
0.306425 |
$3,263,441 |
3263441.2988496 |
|
 Robinson Tejeda
 |
Tejeda Robinson |
RP |
$1,550,000 |
1550000 |
3.92% |
3.92 |
-0.15 |
-0.154361 |
— |
0 |
— |
0 |
|
 Alex Gordon
 |
Gordon Alex |
LF |
$1,400,000 |
1400000 |
3.54% |
3.54 |
7.17 |
7.1714 |
5.12 |
5.1224285714286 |
$195,220 |
195219.90127451 |
|
 Aaron Crow
 |
Crow Aaron |
RP |
$1,400,000 |
1400000 |
3.54% |
3.54 |
0.90 |
0.89698 |
0.64 |
0.6407 |
$1,560,793 |
1560792.8827845 |
|
 Noel Arguelles
 |
Arguelles Noel |
DNP |
$1,380,000 |
1380000 |
3.49% |
3.49 |
— |
0.00 |
— |
0 |
— |
0 |
|
 Melky Cabrera
 |
Cabrera Melky |
CF |
$1,250,000 |
1250000 |
3.16% |
3.16 |
2.78 |
2.77707 |
2.22 |
2.221656 |
$450,115 |
450114.68922281 |
|
 Wilson Betemit
 |
Betemit Wilson |
3B |
$1,000,000 |
1000000 |
2.53% |
2.53 |
0.58 |
0.575315 |
0.58 |
0.575315 |
$1,738,178 |
1738178.2154124 |
|
 Matt Treanor
 |
Treanor Matt |
C |
$850,000 |
850000 |
2.15% |
2.15 |
-0.76 |
-0.76136 |
— |
0 |
— |
0 |
|
 Brayan Peña
 |
Pena Brayan |
C |
$660,000 |
660000 |
1.67% |
1.67 |
0.77 |
0.769806 |
1.17 |
1.1663727272727 |
$857,359 |
857358.86703923 |
|
 Mike Aviles
 |
Aviles Mike |
3B |
$640,000 |
640000 |
1.62% |
1.62 |
-0.30 |
-0.296852 |
— |
0 |
— |
0 |
|
 Mitch Maier
 |
Maier Mitch |
PH |
$459,000 |
459000 |
1.16% |
1.16 |
0.18 |
0.176226 |
0.38 |
0.38393464052288 |
$2,604,610 |
2604609.9894454 |
|
 Chris Getz
 |
Getz Chris |
2B |
$443,000 |
443000 |
1.12% |
1.12 |
0.09 |
0.0867704 |
0.20 |
0.19586997742664 |
$5,105,428 |
5105427.6573578 |
|
 Alcides Escobar
 |
Escobar Alcides |
SS |
$428,000 |
428000 |
1.08% |
1.08 |
0.83 |
0.827826 |
1.93 |
1.9341728971963 |
$517,017 |
517016.86103118 |
|
 Kanekoa Texeira
 |
Texeira Kanekoa |
RP |
$426,000 |
426000 |
1.08% |
1.08 |
-0.14 |
-0.135456 |
— |
0 |
— |
0 |
|
 Sean O'Sullivan
 |
O'Sullivan Sean |
RP |
$420,500 |
420500 |
1.06% |
1.06 |
-1.36 |
-1.36171 |
— |
0 |
— |
0 |
|
 Kila Ka'aihue
 |
Ka'aihue Kila |
1B |
$419,000 |
419000 |
1.06% |
1.06 |
-0.20 |
-0.200884 |
— |
0 |
— |
0 |
|
 Jeremy Jeffress
 |
Jeffress Jeremy |
RP |
$414,500 |
414500 |
1.05% |
1.05 |
-0.06 |
-0.063099 |
— |
0 |
— |
0 |
|
 Nate Adcock
 |
Adcock Nate |
RP |
$414,000 |
414000 |
1.05% |
1.05 |
-0.53 |
-0.533649 |
— |
0 |
— |
0 |
|
 Henry Barrera
 |
Barrera Henry |
DNP |
$414,000 |
414000 |
1.05% |
1.05 |
— |
0.00 |
— |
0 |
— |
0 |
|
 Tim Collins
 |
Collins Tim |
RP |
$414,000 |
414000 |
1.05% |
1.05 |
-0.02 |
-0.0233457 |
— |
0 |
— |
0 |
|
 Jarrod Dyson
 |
Dyson Jarrod |
CF |
$414,000 |
414000 |
1.05% |
1.05 |
0.09 |
0.0879944 |
0.21 |
0.21254685990338 |
$4,704,845 |
4704844.8537634 |
|
| Year | Royals payroll |
PR Sort |
Avg payroll |
AvgPR Sort |
Diff |
Diff Sort |
|---|
| 1984 | $40,000 | 40000 | $260,000 | 260000 | $-220,000 | -220000 |
| 1985 | $150,000 | 150000 | $437,500 | 437500 | $-287,500 | -287500 |
| 1986 | $925,000 | 925000 | $552,000 | 552000 | $373,000 | 373000 |
| 1987 | $740,000 | 740000 | $589,500 | 589500 | $150,500 | 150500 |
| 1988 | $1,100,000 | 1100000 | $732,083 | 732083 | $367,917 | 367917 |
| 1989 | $1,250,000 | 1250000 | $862,714 | 862714 | $387,286 | 387286 |
| 1990 | $1,375,000 | 1375000 | $1,203,571 | 1203571 | $171,429 | 171429 |
| 1991 | $2,950,000 | 2950000 | $1,884,642 | 1884642 | $1,065,358 | 1065358 |
| 1997 | $175,000 | 175000 | $4,892,222 | 4892222 | $-4,717,222 | -4717222 |
| 1998 | $230,000 | 230000 | $6,661,904 | 6661904 | $-6,431,904 | -6431904 |
| 1999 | $460,000 | 460000 | $7,867,823 | 7867823 | $-7,407,823 | -7407823 |
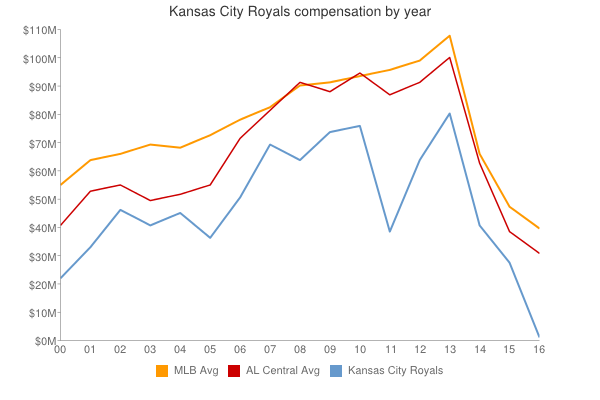
| 2000 | $22,835,500 | 22835500 | $56,164,089 | 56164089 | $-33,328,589 | -33328589 |
| 2001 | $34,805,000 | 34805000 | $65,991,638 | 65991638 | $-31,186,638 | -31186638 |
| 2002 | $47,427,000 | 47427000 | $68,244,471 | 68244471 | $-20,817,471 | -20817471 |
| 2003 | $41,268,000 | 41268000 | $71,318,479 | 71318479 | $-30,050,479 | -30050479 |
| 2004 | $46,671,500 | 46671500 | $70,466,961 | 70466961 | $-23,795,461 | -23795461 |
| 2005 | $37,882,000 | 37882000 | $73,264,780 | 73264780 | $-35,382,780 | -35382780 |
| 2006 | $51,655,500 | 51655500 | $79,051,754 | 79051754 | $-27,396,254 | -27396254 |
| 2007 | $70,227,500 | 70227500 | $83,931,138 | 83931138 | $-13,703,638 | -13703638 |
| 2008 | $63,830,500 | 63830500 | $90,812,373 | 90812373 | $-26,981,873 | -26981873 |
| 2009 | $77,970,833 | 77970833 | $91,093,211 | 91093211 | $-13,122,378 | -13122378 |
| 2010 | $76,260,210 | 76260210 | $93,373,681 | 93373681 | $-17,113,471 | -17113471 |
| 2011 | $39,506,000 | 39506000 | $96,102,034 | 96102034 | $-56,596,034 | -56596034 |
| 2012 | $64,485,350 | 64485350 | $100,657,138 | 100657138 | $-36,171,788 | -36171788 |
| 2013 | $81,721,725 | 81721725 | $109,024,990 | 109024990 | $-27,303,265 | -27303265 |
| 2014 | $92,185,521 | 92185521 | $117,828,782 | 117828782 | $-25,643,261 | -25643261 |
| 2015 | $112,857,025 | 112857025 | $127,404,244 | 127404244 | $-14,547,219 | -14547219 |
| 2016 | $131,487,125 | 131487125 | $132,219,407 | 132219407 | $-732,282 | -732282 |
| 2017 | $139,555,817 | 139555817 | $137,302,894 | 137302894 | $2,252,923 | 2252923 |
| 2018 | $124,733,117 | 124733117 | $136,929,168 | 136929168 | $-12,196,051 | -12196051 |
| 2019 | $96,470,066 | 96470066 | $136,944,257 | 136944257 | $-40,474,191 | -40474191 |
| 2020 | $84,548,842 | 84548842 | $140,677,788 | 140677788 | $-56,128,946 | -56128946 |
| 2021 | $83,438,450 | 83438450 | $132,162,631 | 132162631 | $-48,724,181 | -48724181 |
| 2022 | $94,832,900 | 94832900 | $149,374,046 | 149374046 | $-54,541,146 | -54541146 |
| 2023 | $83,968,100 | 83968100 | $160,460,390 | 160460390 | $-76,492,290 | -76492290 |
| 2024 | $77,773,611 | 77773611 | $135,504,022 | 135504022 | $-57,730,411 | -57730411 |
| 2025 | $57,111,111 | 57111111 | $96,417,302 | 96417302 | $-39,306,191 | -39306191 |
| 2026 | $16,111,111 | 16111111 | $76,694,120 | 76694120 | $-60,583,009 | -60583009 |
| 2027 | $20,111,111 | 20111111 | $58,935,617 | 58935617 | $-38,824,506 | -38824506 |
| 2028 | $31,111,111 | 31111111 | $45,437,759 | 45437759 | $-14,326,648 | -14326648 |
| 2029 | $36,111,111 | 36111111 | $37,269,628 | 37269628 | $-1,158,517 | -1158517 |
| 2030 | $36,111,111 | 36111111 | $39,665,769 | 39665769 | $-3,554,658 | -3554658 |
| 2031 | $35,000,000 | 35000000 | $38,360,152 | 38360152 | $-3,360,152 | -3360152 |
| 2032 | $35,000,000 | 35000000 | $47,925,459 | 47925459 | $-12,925,459 | -12925459 |
| 2033 | $35,000,000 | 35000000 | $43,068,924 | 43068924 | $-8,068,924 | -8068924 |
| 2034 | $35,000,000 | 35000000 | $29,428,571 | 29428571 | $5,571,429 | 5571429 |
|
 2011 Kansas City Royals