| Player | Player Sort | Pos | Salary | Salary Sort | Pct | Pct Sort | WARP | WARP Sort | WARP/$M | WARP/$M Sort | $/WARP | $/WARP Sort | Current Status |
|---|
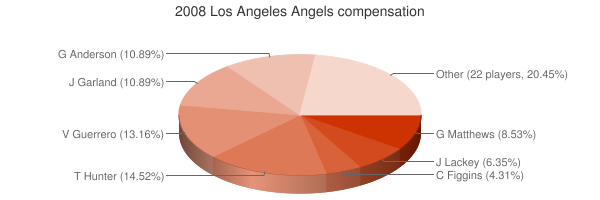
 Torii Hunter
 |
Hunter Torii |
CF |
$16,500,000 |
16500000 |
13.77% |
13.77 |
2.85 |
2.8549 |
0.17 |
0.17302424242424 |
$5,779,537 |
5779536.9364951 |
|
 Vladimir Guerrero
 |
Guerrero Vladimir |
RF |
$15,500,000 |
15500000 |
12.94% |
12.94 |
2.34 |
2.33607 |
0.15 |
0.15071419354839 |
$6,635,075 |
6635075.1475769 |
|
 Garret Anderson
 |
Anderson Garret |
LF |
$12,600,000 |
12600000 |
10.52% |
10.52 |
1.03 |
1.03207 |
0.08 |
0.081910317460317 |
$12,208,474 |
12208474.231399 |
|
 Jon Garland
 |
Garland Jon |
RP |
$12,000,000 |
12000000 |
10.02% |
10.02 |
-0.41 |
-0.410195 |
— |
0 |
— |
0 |
|
 Francisco Rodríguez
 |
Rodriguez Francisco |
RP |
$10,000,000 |
10000000 |
8.35% |
8.35 |
1.83 |
1.83385 |
0.18 |
0.183385 |
$5,453,009 |
5453008.6975489 |
|
 Kelvim Escobar
 |
Escobar Kelvim |
DNP |
$9,500,000 |
9500000 |
7.93% |
7.93 |
— |
0.00 |
— |
0 |
— |
0 |
|
 Gary Matthews
 |
Matthews Gary |
RF |
$9,400,000 |
9400000 |
7.85% |
7.85 |
-0.88 |
-0.878736 |
— |
0 |
— |
0 |
|
 John Lackey
 |
Lackey John |
RP |
$7,000,000 |
7000000 |
5.84% |
5.84 |
1.24 |
1.23573 |
0.18 |
0.17653285714286 |
$5,664,668 |
5664667.8481545 |
|
 Chone Figgins
 |
Figgins Chone |
3B |
$4,750,000 |
4750000 |
3.97% |
3.97 |
1.62 |
1.6236 |
0.34 |
0.34181052631579 |
$2,925,597 |
2925597.4377926 |
|
 Scot Shields
 |
Shields Scot |
RP |
$4,250,000 |
4250000 |
3.55% |
3.55 |
0.95 |
0.949279 |
0.22 |
0.22335976470588 |
$4,477,082 |
4477082.0801893 |
|
 Justin Speier
 |
Speier Justin |
RP |
$4,250,000 |
4250000 |
3.55% |
3.55 |
0.50 |
0.499612 |
0.12 |
0.11755576470588 |
$8,506,601 |
8506601.122471 |
|
 Juan Rivera
 |
Rivera Juan |
LF |
$2,025,000 |
2025000 |
1.69% |
1.69 |
0.11 |
0.105458 |
0.05 |
0.052078024691358 |
$19,201,957 |
19201957.177265 |
|
 Darren Oliver
 |
Oliver Darren |
RP |
$2,000,000 |
2000000 |
1.67% |
1.67 |
1.14 |
1.14479 |
0.57 |
0.572395 |
$1,747,045 |
1747045.3096201 |
|
 Casey Kotchman
 |
Kotchman Casey |
1B |
$1,450,000 |
1450000 |
1.21% |
1.21 |
0.56 |
0.558557 |
0.39 |
0.38521172413793 |
$2,595,975 |
2595974.9855431 |
|
 Maicer Izturis
 |
Izturis Maicer |
SS |
$1,200,000 |
1200000 |
1.00% |
1.00 |
0.88 |
0.880069 |
0.73 |
0.73339083333333 |
$1,363,529 |
1363529.4505317 |
|
 Robb Quinlan
 |
Quinlan Robb |
3B |
$1,050,000 |
1050000 |
0.88% |
0.88 |
-0.57 |
-0.568676 |
— |
0 |
— |
0 |
FA/2011 |
 Kendrys Morales
 |
Morales Kendrys |
RF |
$500,000 |
500000 |
0.42% |
0.42 |
-0.26 |
-0.261839 |
— |
0 |
— |
0 |
|
 Jered Weaver
 |
Weaver Jered |
RP |
$435,000 |
435000 |
0.36% |
0.36 |
1.27 |
1.26747 |
2.91 |
2.913724137931 |
$343,203 |
343203.38942934 |
|
 Reggie Willits
 |
Willits Reggie |
LF |
$432,500 |
432500 |
0.36% |
0.36 |
-0.59 |
-0.58838 |
— |
0 |
— |
0 |
|
 Howie Kendrick
 |
Kendrick Howie |
2B |
$432,500 |
432500 |
0.36% |
0.36 |
1.97 |
1.972 |
4.56 |
4.5595375722543 |
$219,320 |
219320.48681542 |
|
 Mike Napoli
 |
Napoli Mike |
C |
$425,000 |
425000 |
0.35% |
0.35 |
2.00 |
1.99799 |
4.70 |
4.7011529411765 |
$212,714 |
212713.77734623 |
|
 Joe Saunders
 |
Saunders Joe |
RP |
$425,000 |
425000 |
0.35% |
0.35 |
2.77 |
2.7715 |
6.52 |
6.5211764705882 |
$153,347 |
153346.56323291 |
|
 Ervin Santana
 |
Santana Ervin |
RP |
$420,000 |
420000 |
0.35% |
0.35 |
6.36 |
6.35611 |
15.13 |
15.133595238095 |
$66,078 |
66078.15157384 |
|
 Dustin Moseley
 |
Moseley Dustin |
RP |
$420,000 |
420000 |
0.35% |
0.35 |
-0.17 |
-0.167085 |
— |
0 |
— |
0 |
|
 Erick Aybar
 |
Aybar Erick |
SS |
$415,000 |
415000 |
0.35% |
0.35 |
1.72 |
1.72404 |
4.15 |
4.154313253012 |
$240,714 |
240713.6725366 |
|
 Jeff Mathis
 |
Mathis Jeff |
C |
$415,000 |
415000 |
0.35% |
0.35 |
1.16 |
1.16391 |
2.80 |
2.8046024096386 |
$356,557 |
356556.77844507 |
|
 Chris Bootcheck
 |
Bootcheck Chris |
RP |
$415,000 |
415000 |
0.35% |
0.35 |
0.17 |
0.17371 |
0.42 |
0.41857831325301 |
$2,389,039 |
2389039.2032698 |
|
 Chad Orvella
 |
Orvella Chad |
DNP |
$400,700 |
400700 |
0.33% |
0.33 |
— |
0.00 |
— |
0 |
— |
0 |
|
 Jason Bulger
 |
Bulger Jason |
RP |
$392,000 |
392000 |
0.33% |
0.33 |
0.31 |
0.313291 |
0.80 |
0.79921173469388 |
$1,251,233 |
1251232.8793358 |
|
 Rich Thompson
 |
Thompson Rich |
RP |
$391,000 |
391000 |
0.33% |
0.33 |
0.04 |
0.0447141 |
0.11 |
0.11435831202046 |
$8,744,445 |
8744445.2644692 |
|
 Darren O'Day
 |
O'Day Darren |
RP |
$390,000 |
390000 |
0.33% |
0.33 |
0.07 |
0.0662398 |
0.17 |
0.16984564102564 |
$5,887,699 |
5887698.9362891 |
|
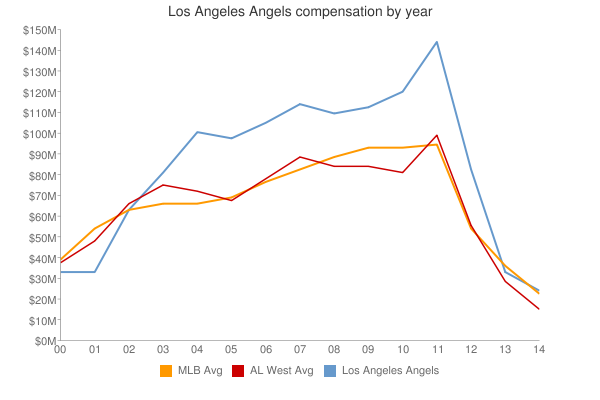
| Year | Angels payroll |
PR Sort |
Avg payroll |
AvgPR Sort |
Diff |
Diff Sort |
|---|
| 2000 | $51,464,167 | 51464167 | $56,164,089 | 56164089 | $-4,699,922 | -4699922 |
| 2001 | $46,945,167 | 46945167 | $65,991,638 | 65991638 | $-19,046,471 | -19046471 |
| 2002 | $61,414,167 | 61414167 | $68,244,471 | 68244471 | $-6,830,304 | -6830304 |
| 2003 | $77,001,667 | 77001667 | $71,318,479 | 71318479 | $5,683,188 | 5683188 |
| 2004 | $99,197,000 | 99197000 | $70,466,961 | 70466961 | $28,730,039 | 28730039 |
| 2005 | $95,492,822 | 95492822 | $73,264,780 | 73264780 | $22,228,042 | 22228042 |
| 2006 | $102,392,000 | 102392000 | $79,051,754 | 79051754 | $23,340,246 | 23340246 |
| 2007 | $109,068,500 | 109068500 | $83,931,138 | 83931138 | $25,137,362 | 25137362 |
| 2008 | $119,783,700 | 119783700 | $90,812,373 | 90812373 | $28,971,327 | 28971327 |
| 2009 | $112,869,000 | 112869000 | $91,093,211 | 91093211 | $21,775,789 | 21775789 |
| 2010 | $120,613,867 | 120613867 | $93,373,681 | 93373681 | $27,240,186 | 27240186 |
| 2011 | $145,398,524 | 145398524 | $96,102,034 | 96102034 | $49,296,490 | 49296490 |
| 2012 | $155,023,024 | 155023024 | $100,657,138 | 100657138 | $54,365,886 | 54365886 |
| 2013 | $141,039,107 | 141039107 | $109,024,990 | 109024990 | $32,014,117 | 32014117 |
| 2014 | $158,189,357 | 158189357 | $117,828,782 | 117828782 | $40,360,575 | 40360575 |
| 2015 | $141,650,332 | 141650332 | $127,404,244 | 127404244 | $14,246,088 | 14246088 |
| 2016 | $164,673,333 | 164673333 | $132,219,407 | 132219407 | $32,453,926 | 32453926 |
| 2017 | $166,375,833 | 166375833 | $137,302,894 | 137302894 | $29,072,939 | 29072939 |
| 2018 | $166,649,999 | 166649999 | $136,929,168 | 136929168 | $29,720,831 | 29720831 |
| 2019 | $158,878,583 | 158878583 | $136,944,257 | 136944257 | $21,934,326 | 21934326 |
| 2020 | $180,711,036 | 180711036 | $140,677,788 | 140677788 | $40,033,248 | 40033248 |
| 2021 | $164,391,595 | 164391595 | $132,162,631 | 132162631 | $32,228,964 | 32228964 |
| 2022 | $181,113,095 | 181113095 | $149,374,046 | 149374046 | $31,739,049 | 31739049 |
| 2023 | $203,528,096 | 203528096 | $160,460,390 | 160460390 | $43,067,706 | 43067706 |
| 2024 | $146,313,095 | 146313095 | $135,504,022 | 135504022 | $10,809,073 | 10809073 |
| 2025 | $107,688,095 | 107688095 | $96,417,302 | 96417302 | $11,270,793 | 11270793 |
| 2026 | $87,688,095 | 87688095 | $76,694,120 | 76694120 | $10,993,975 | 10993975 |
| 2027 | $37,116,667 | 37116667 | $58,935,617 | 58935617 | $-21,818,950 | -21818950 |
| 2028 | $37,116,667 | 37116667 | $45,437,759 | 45437759 | $-8,321,092 | -8321092 |
| 2029 | $37,116,667 | 37116667 | $37,269,628 | 37269628 | $-152,961 | -152961 |
| 2030 | $37,116,667 | 37116667 | $39,665,769 | 39665769 | $-2,549,102 | -2549102 |
|
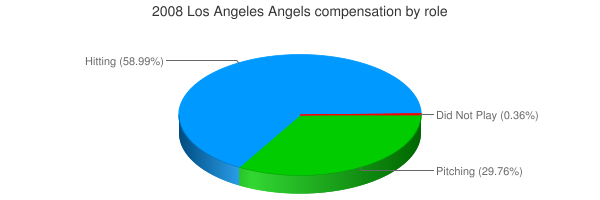
 2008 Los Angeles Angels