| Player | Player Sort | Pos | Salary | Salary Sort | Pct | Pct Sort | WARP | WARP Sort | WARP/$M | WARP/$M Sort | $/WARP | $/WARP Sort | Current Status |
|---|
 Mike Sweeney
 |
Sweeney Mike |
DH |
$11,000,000 |
11000000 |
15.66% |
15.66 |
0.14 |
0.136854 |
0.01 |
0.012441272727273 |
$80,377,629 |
80377628.713812 |
|
 Odalis Perez
 |
Perez Odalis |
RP |
$7,750,000 |
7750000 |
11.04% |
11.04 |
-2.16 |
-2.15825 |
— |
0 |
— |
0 |
|
 Gil Meche
 |
Meche Gil |
RP |
$7,400,000 |
7400000 |
10.54% |
10.54 |
3.89 |
3.89258 |
0.53 |
0.52602432432432 |
$1,901,053 |
1901052.7721974 |
|
 Jason LaRue
 |
LaRue Jason |
C |
$5,450,000 |
5450000 |
7.76% |
7.76 |
-1.61 |
-1.61449 |
— |
0 |
— |
0 |
|
 Octavio Dotel
 |
Dotel Octavio |
RP |
$5,000,000 |
5000000 |
7.12% |
7.12 |
0.62 |
0.615891 |
0.12 |
0.1231782 |
$8,118,320 |
8118319.6377281 |
|
 Reggie Sanders
 |
Sanders Reggie |
RF |
$5,000,000 |
5000000 |
7.12% |
7.12 |
0.55 |
0.554266 |
0.11 |
0.1108532 |
$9,020,939 |
9020939.4045458 |
|
 Mark Grudzielanek
 |
Grudzielanek Mark |
2B |
$4,000,000 |
4000000 |
5.70% |
5.70 |
1.00 |
1.00208 |
0.25 |
0.25052 |
$3,991,697 |
3991697.2696791 |
FA/2011 |
 Scott Elarton
 |
Elarton Scott |
RP |
$4,000,000 |
4000000 |
5.70% |
5.70 |
-1.85 |
-1.85053 |
— |
0 |
— |
0 |
|
 Emil Brown
 |
Brown Emil |
LF |
$3,450,000 |
3450000 |
4.91% |
4.91 |
0.45 |
0.447481 |
0.13 |
0.12970463768116 |
$7,709,825 |
7709824.55121 |
|
 Angel Berroa
 |
Berroa Angel |
SS |
$3,250,000 |
3250000 |
4.63% |
4.63 |
-0.15 |
-0.153149 |
— |
0 |
— |
0 |
|
 David Riske
 |
Riske David |
RP |
$2,000,000 |
2000000 |
2.85% |
2.85 |
1.13 |
1.12834 |
0.56 |
0.56417 |
$1,772,515 |
1772515.3765709 |
|
 David DeJesus
 |
DeJesus David |
CF |
$2,000,000 |
2000000 |
2.85% |
2.85 |
0.15 |
0.150718 |
0.08 |
0.075359 |
$13,269,815 |
13269815.151475 |
|
 John Bale
 |
Bale John |
RP |
$1,800,000 |
1800000 |
2.56% |
2.56 |
1.01 |
1.01371 |
0.56 |
0.56317222222222 |
$1,775,656 |
1775655.7595368 |
Arb3/2011, FA/2012 |
 Jimmy Gobble
 |
Gobble Jimmy |
RP |
$712,500 |
712500 |
1.01% |
1.01 |
0.48 |
0.481156 |
0.68 |
0.67530666666667 |
$1,480,809 |
1480808.7190017 |
|
 Todd Wellemeyer
 |
Wellemeyer Todd |
RP |
$635,000 |
635000 |
0.90% |
0.90 |
0.05 |
0.0490919 |
0.08 |
0.077310078740157 |
$12,934,924 |
12934924.091347 |
|
 Ross Gload
 |
Gload Ross |
1B |
$625,000 |
625000 |
0.89% |
0.89 |
0.99 |
0.992167 |
1.59 |
1.5874672 |
$629,934 |
629934.27517747 |
|
 Brandon Duckworth
 |
Duckworth Brandon |
RP |
$550,000 |
550000 |
0.78% |
0.78 |
-0.15 |
-0.15028 |
— |
0 |
— |
0 |
|
 John Buck
 |
Buck John |
C |
$440,000 |
440000 |
0.63% |
0.63 |
2.65 |
2.64915 |
6.02 |
6.0207954545455 |
$166,091 |
166091.01032407 |
|
 Esteban German
 |
German Esteban |
2B |
$423,000 |
423000 |
0.60% |
0.60 |
0.03 |
0.0335093 |
0.08 |
0.079218203309693 |
$12,623,361 |
12623361.275825 |
|
 Luke Hudson
 |
Hudson Luke |
RP |
$422,000 |
422000 |
0.60% |
0.60 |
-0.09 |
-0.0948235 |
— |
0 |
— |
0 |
|
 Jorge De La Rosa
 |
De La Rosa Jorge |
RP |
$417,000 |
417000 |
0.59% |
0.59 |
-2.06 |
-2.0557 |
— |
0 |
— |
0 |
|
 Mark Teahen
 |
Teahen Mark |
RF |
$416,000 |
416000 |
0.59% |
0.59 |
3.09 |
3.08579 |
7.42 |
7.4177644230769 |
$134,812 |
134811.50693988 |
|
 Zack Greinke
 |
Greinke Zack |
RP |
$407,000 |
407000 |
0.58% |
0.58 |
1.85 |
1.85408 |
4.56 |
4.5554791154791 |
$219,516 |
219515.87849499 |
|
 Joel Peralta
 |
Peralta Joel |
RP |
$400,500 |
400500 |
0.57% |
0.57 |
1.40 |
1.39964 |
3.49 |
3.4947315855181 |
$286,145 |
286145.00871653 |
|
 Ryan Shealy
 |
Shealy Ryan |
1B |
$392,500 |
392500 |
0.56% |
0.56 |
-0.96 |
-0.962328 |
— |
0 |
— |
0 |
Arb2/2011, Arb3/2012, FA/2013 |
 Roman Colon
 |
Colon Roman |
DNP |
$385,000 |
385000 |
0.55% |
0.55 |
— |
0.00 |
— |
0 |
— |
0 |
|
 Juan Carlos Oviedo
 |
Oviedo Juan Carlos |
RP |
$382,000 |
382000 |
0.54% |
0.54 |
0.15 |
0.145524 |
0.38 |
0.38095287958115 |
$2,624,997 |
2624996.5641406 |
|
 Alex Gordon
 |
Gordon Alex |
3B |
$380,000 |
380000 |
0.54% |
0.54 |
1.21 |
1.20671 |
3.18 |
3.1755526315789 |
$314,906 |
314905.81829934 |
|
 Ryan Braun
 |
Braun Ryan |
RP |
$380,000 |
380000 |
0.54% |
0.54 |
-0.61 |
-0.614253 |
— |
0 |
— |
0 |
|
 Joakim Soria
 |
Soria Joakim |
RP |
$380,000 |
380000 |
0.54% |
0.54 |
2.16 |
2.1565 |
5.68 |
5.675 |
$176,211 |
176211.45374449 |
|
 Tony Pena Jr.
 |
Pena Tony |
SS |
$380,000 |
380000 |
0.54% |
0.54 |
0.99 |
0.9897 |
2.60 |
2.6044736842105 |
$383,955 |
383954.7337577 |
|
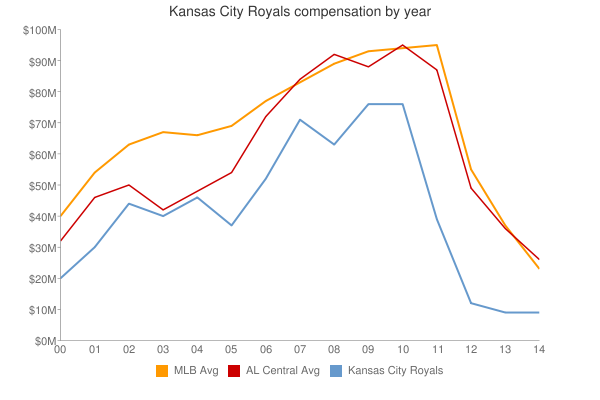
| Year | Royals payroll |
PR Sort |
Avg payroll |
AvgPR Sort |
Diff |
Diff Sort |
|---|
| 1984 | $40,000 | 40000 | $260,000 | 260000 | $-220,000 | -220000 |
| 1985 | $150,000 | 150000 | $437,500 | 437500 | $-287,500 | -287500 |
| 1986 | $925,000 | 925000 | $552,000 | 552000 | $373,000 | 373000 |
| 1987 | $740,000 | 740000 | $589,500 | 589500 | $150,500 | 150500 |
| 1988 | $1,100,000 | 1100000 | $732,083 | 732083 | $367,917 | 367917 |
| 1989 | $1,250,000 | 1250000 | $862,714 | 862714 | $387,286 | 387286 |
| 1990 | $1,375,000 | 1375000 | $1,203,571 | 1203571 | $171,429 | 171429 |
| 1991 | $2,950,000 | 2950000 | $1,884,642 | 1884642 | $1,065,358 | 1065358 |
| 1997 | $175,000 | 175000 | $4,892,222 | 4892222 | $-4,717,222 | -4717222 |
| 1998 | $230,000 | 230000 | $6,661,904 | 6661904 | $-6,431,904 | -6431904 |
| 1999 | $460,000 | 460000 | $7,867,823 | 7867823 | $-7,407,823 | -7407823 |
| 2000 | $22,835,500 | 22835500 | $56,164,089 | 56164089 | $-33,328,589 | -33328589 |
| 2001 | $34,805,000 | 34805000 | $65,991,638 | 65991638 | $-31,186,638 | -31186638 |
| 2002 | $47,427,000 | 47427000 | $68,244,471 | 68244471 | $-20,817,471 | -20817471 |
| 2003 | $41,268,000 | 41268000 | $71,318,479 | 71318479 | $-30,050,479 | -30050479 |
| 2004 | $46,671,500 | 46671500 | $70,466,961 | 70466961 | $-23,795,461 | -23795461 |
| 2005 | $37,882,000 | 37882000 | $73,264,780 | 73264780 | $-35,382,780 | -35382780 |
| 2006 | $51,655,500 | 51655500 | $79,051,754 | 79051754 | $-27,396,254 | -27396254 |
| 2007 | $70,227,500 | 70227500 | $83,931,138 | 83931138 | $-13,703,638 | -13703638 |
| 2008 | $63,830,500 | 63830500 | $90,812,373 | 90812373 | $-26,981,873 | -26981873 |
| 2009 | $77,970,833 | 77970833 | $91,093,211 | 91093211 | $-13,122,378 | -13122378 |
| 2010 | $76,260,210 | 76260210 | $93,373,681 | 93373681 | $-17,113,471 | -17113471 |
| 2011 | $39,506,000 | 39506000 | $96,102,034 | 96102034 | $-56,596,034 | -56596034 |
| 2012 | $64,485,350 | 64485350 | $100,657,138 | 100657138 | $-36,171,788 | -36171788 |
| 2013 | $81,721,725 | 81721725 | $109,024,990 | 109024990 | $-27,303,265 | -27303265 |
| 2014 | $92,185,521 | 92185521 | $117,828,782 | 117828782 | $-25,643,261 | -25643261 |
| 2015 | $112,857,025 | 112857025 | $127,404,244 | 127404244 | $-14,547,219 | -14547219 |
| 2016 | $131,487,125 | 131487125 | $132,219,407 | 132219407 | $-732,282 | -732282 |
| 2017 | $139,555,817 | 139555817 | $137,302,894 | 137302894 | $2,252,923 | 2252923 |
| 2018 | $124,733,117 | 124733117 | $136,929,168 | 136929168 | $-12,196,051 | -12196051 |
| 2019 | $96,470,066 | 96470066 | $136,944,257 | 136944257 | $-40,474,191 | -40474191 |
| 2020 | $84,548,842 | 84548842 | $140,677,788 | 140677788 | $-56,128,946 | -56128946 |
| 2021 | $83,438,450 | 83438450 | $132,162,631 | 132162631 | $-48,724,181 | -48724181 |
| 2022 | $94,832,900 | 94832900 | $149,374,046 | 149374046 | $-54,541,146 | -54541146 |
| 2023 | $83,968,100 | 83968100 | $160,460,390 | 160460390 | $-76,492,290 | -76492290 |
| 2024 | $77,773,611 | 77773611 | $135,504,022 | 135504022 | $-57,730,411 | -57730411 |
| 2025 | $57,111,111 | 57111111 | $96,417,302 | 96417302 | $-39,306,191 | -39306191 |
| 2026 | $16,111,111 | 16111111 | $76,694,120 | 76694120 | $-60,583,009 | -60583009 |
| 2027 | $20,111,111 | 20111111 | $58,935,617 | 58935617 | $-38,824,506 | -38824506 |
| 2028 | $31,111,111 | 31111111 | $45,437,759 | 45437759 | $-14,326,648 | -14326648 |
| 2029 | $36,111,111 | 36111111 | $37,269,628 | 37269628 | $-1,158,517 | -1158517 |
| 2030 | $36,111,111 | 36111111 | $39,665,769 | 39665769 | $-3,554,658 | -3554658 |
| 2031 | $35,000,000 | 35000000 | $38,360,152 | 38360152 | $-3,360,152 | -3360152 |
| 2032 | $35,000,000 | 35000000 | $47,925,459 | 47925459 | $-12,925,459 | -12925459 |
| 2033 | $35,000,000 | 35000000 | $43,068,924 | 43068924 | $-8,068,924 | -8068924 |
| 2034 | $35,000,000 | 35000000 | $29,428,571 | 29428571 | $5,571,429 | 5571429 |
|
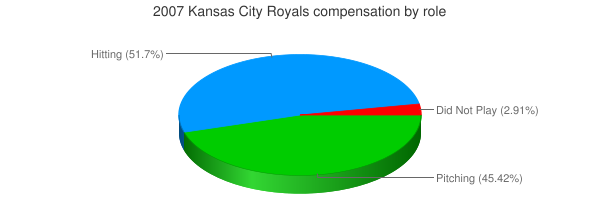
 2007 Kansas City Royals