| Player | Player Sort | Pos | Salary | Salary Sort | Pct | Pct Sort | WARP | WARP Sort | WARP/$M | WARP/$M Sort | $/WARP | $/WARP Sort | Current Status |
|---|
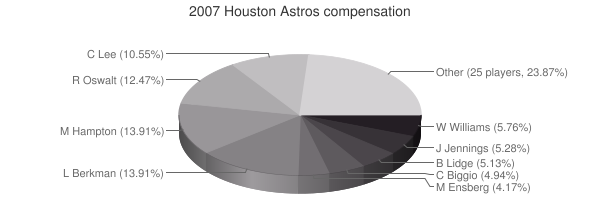
 Lance Berkman
 |
Berkman Lance |
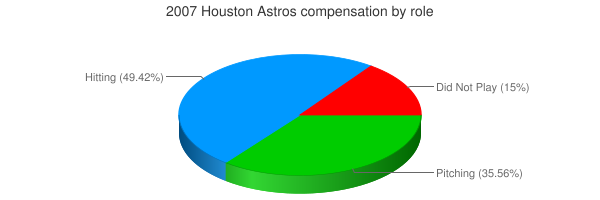
1B |
$14,500,000 |
14500000 |
16.07% |
16.07 |
3.35 |
3.35115 |
0.23 |
0.23111379310345 |
$4,326,873 |
4326872.864539 |
|
 Roy Oswalt
 |
Oswalt Roy |
RP |
$13,000,000 |
13000000 |
14.41% |
14.41 |
5.99 |
5.99166 |
0.46 |
0.46089692307692 |
$2,169,683 |
2169682.5253769 |
|
 Carlos Lee
 |
Lee Carlos |
LF |
$11,500,000 |
11500000 |
12.75% |
12.75 |
1.77 |
1.7716 |
0.15 |
0.15405217391304 |
$6,491,307 |
6491307.2928426 |
|
 Woody Williams
 |
Williams Woody |
RP |
$6,000,000 |
6000000 |
6.65% |
6.65 |
-1.09 |
-1.08622 |
— |
0 |
— |
0 |
|
 Jason Jennings
 |
Jennings Jason |
RP |
$5,500,000 |
5500000 |
6.10% |
6.10 |
-0.47 |
-0.47003 |
— |
0 |
— |
0 |
|
 Brad Lidge
 |
Lidge Brad |
RP |
$5,350,000 |
5350000 |
5.93% |
5.93 |
2.11 |
2.11459 |
0.40 |
0.39525046728972 |
$2,530,041 |
2530041.2845989 |
|
 Craig Biggio
 |
Biggio Craig |
2B |
$5,150,000 |
5150000 |
5.71% |
5.71 |
-0.85 |
-0.84828 |
— |
0 |
— |
0 |
|
 Morgan Ensberg
 |
Ensberg Morgan |
3B |
$4,350,000 |
4350000 |
4.82% |
4.82 |
0.22 |
0.217866 |
0.05 |
0.050084137931034 |
$19,966,401 |
19966401.365977 |
|
 Brad Ausmus
 |
Ausmus Brad |
C |
$4,000,000 |
4000000 |
4.43% |
4.43 |
3.44 |
3.44487 |
0.86 |
0.8612175 |
$1,161,147 |
1161146.8647583 |
|
 Adam Everett
 |
Everett Adam |
SS |
$2,800,000 |
2800000 |
3.10% |
3.10 |
0.03 |
0.0332836 |
0.01 |
0.011887 |
$84,125,515 |
84125515.268781 |
|
 Mike Lamb
 |
Lamb Mike |
3B |
$2,700,000 |
2700000 |
2.99% |
2.99 |
2.24 |
2.23912 |
0.83 |
0.8293037037037 |
$1,205,831 |
1205830.8621244 |
|
 Mark Loretta
 |
Loretta Mark |
SS |
$2,500,000 |
2500000 |
2.77% |
2.77 |
-0.24 |
-0.244462 |
— |
0 |
— |
0 |
|
 Dan Wheeler
 |
Wheeler Dan |
RP |
$2,100,000 |
2100000 |
2.33% |
2.33 |
1.33 |
1.33199 |
0.63 |
0.63428095238095 |
$1,576,588 |
1576588.4128259 |
|
 Trever Miller
 |
Miller Trever |
RP |
$1,300,000 |
1300000 |
1.44% |
1.44 |
0.55 |
0.553413 |
0.43 |
0.42570230769231 |
$2,349,059 |
2349059.3824142 |
|
 Jason Lane
 |
Lane Jason |
CF |
$1,050,000 |
1050000 |
1.16% |
1.16 |
0.07 |
0.0743014 |
0.07 |
0.070763238095238 |
$14,131,631 |
14131631.436285 |
|
 Orlando Palmeiro
 |
Palmeiro Orlando |
PH |
$950,000 |
950000 |
1.05% |
1.05 |
-0.06 |
-0.0582494 |
— |
0 |
— |
0 |
|
 Rick White
 |
White Rick |
RP |
$600,000 |
600000 |
0.66% |
0.66 |
0.15 |
0.145356 |
0.24 |
0.24226 |
$4,127,797 |
4127796.5821844 |
|
 Dave Borkowski
 |
Borkowski Dave |
RP |
$575,000 |
575000 |
0.64% |
0.64 |
1.00 |
1.00472 |
1.75 |
1.7473391304348 |
$572,299 |
572298.74990047 |
|
 Brandon Backe
 |
Backe Brandon |
RP |
$545,000 |
545000 |
0.60% |
0.60 |
0.06 |
0.0556786 |
0.10 |
0.10216256880734 |
$9,788,321 |
9788320.8270323 |
|
 Eric Bruntlett
 |
Bruntlett Eric |
SS |
$525,000 |
525000 |
0.58% |
0.58 |
0.23 |
0.230128 |
0.44 |
0.43833904761905 |
$2,281,339 |
2281339.0808593 |
|
 Brian Moehler
 |
Moehler Brian |
RP |
$500,000 |
500000 |
0.55% |
0.55 |
0.92 |
0.915745 |
1.83 |
1.83149 |
$546,004 |
546003.52718279 |
|
 Chad Qualls
 |
Qualls Chad |
RP |
$441,000 |
441000 |
0.49% |
0.49 |
2.16 |
2.16464 |
4.91 |
4.9084807256236 |
$203,729 |
203729.02653559 |
|
 Eric Munson
 |
Munson Eric |
C |
$425,000 |
425000 |
0.47% |
0.47 |
-0.52 |
-0.515138 |
— |
0 |
— |
0 |
|
 Chris Burke
 |
Burke Chris |
2B |
$415,000 |
415000 |
0.46% |
0.46 |
-0.12 |
-0.117848 |
— |
0 |
— |
0 |
|
 Wandy Rodriguez
 |
Rodriguez Wandy |
RP |
$406,000 |
406000 |
0.45% |
0.45 |
3.22 |
3.22083 |
7.93 |
7.933078817734 |
$126,054 |
126054.46422196 |
|
 Humberto Quintero
 |
Quintero Humberto |
C |
$385,000 |
385000 |
0.43% |
0.43 |
-0.43 |
-0.42755 |
— |
0 |
— |
0 |
|
 Luke Scott
 |
Scott Luke |
RF |
$382,000 |
382000 |
0.42% |
0.42 |
2.06 |
2.06059 |
5.39 |
5.3942146596859 |
$185,384 |
185383.79784431 |
|
 Casey Daigle
 |
Daigle Casey |
DNP |
$381,500 |
381500 |
0.42% |
0.42 |
— |
0.00 |
— |
0 |
— |
0 |
|
 Matt Albers
 |
Albers Matt |
RP |
$380,000 |
380000 |
0.42% |
0.42 |
-0.08 |
-0.0751372 |
— |
0 |
— |
0 |
|
 Josh Anderson
 |
Anderson Josh |
CF |
$380,000 |
380000 |
0.42% |
0.42 |
0.23 |
0.227706 |
0.60 |
0.59922631578947 |
$1,668,819 |
1668818.564289 |
|
 Paul Estrada
 |
Estrada Paul |
DNP |
$380,000 |
380000 |
0.42% |
0.42 |
— |
0.00 |
— |
0 |
— |
0 |
|
 Mark McLemore
 |
McLemore Mark |
DNP |
$380,000 |
380000 |
0.42% |
0.42 |
— |
0.00 |
— |
0 |
— |
0 |
|
 Chris Sampson
 |
Sampson Chris |
RP |
$380,000 |
380000 |
0.42% |
0.42 |
0.25 |
0.250522 |
0.66 |
0.65926842105263 |
$1,516,833 |
1516832.8530029 |
Arb2/2011, Arb3/2012, FA/2013 |
| Year | Astros payroll |
PR Sort |
Avg payroll |
AvgPR Sort |
Diff |
Diff Sort |
|---|
| 1989 | $78,000 | 78000 | $862,714 | 862714 | $-784,714 | -784714 |
| 1990 | $240,000 | 240000 | $1,203,571 | 1203571 | $-963,571 | -963571 |
| 1991 | $437,500 | 437500 | $1,884,642 | 1884642 | $-1,447,142 | -1447142 |
| 1992 | $1,375,000 | 1375000 | $2,356,071 | 2356071 | $-981,071 | -981071 |
| 1993 | $3,050,000 | 3050000 | $3,410,000 | 3410000 | $-360,000 | -360000 |
| 1994 | $3,375,000 | 3375000 | $3,911,904 | 3911904 | $-536,904 | -536904 |
| 1995 | $4,600,000 | 4600000 | $5,208,333 | 5208333 | $-608,333 | -608333 |
| 1996 | $2,000,000 | 2000000 | $4,583,416 | 4583416 | $-2,583,416 | -2583416 |
| 1997 | $6,180,000 | 6180000 | $4,892,222 | 4892222 | $1,287,778 | 1287778 |
| 1998 | $6,120,000 | 6120000 | $6,661,904 | 6661904 | $-541,904 | -541904 |
| 1999 | $6,060,000 | 6060000 | $7,867,823 | 7867823 | $-1,807,823 | -1807823 |
| 2000 | $51,806,667 | 51806667 | $56,164,089 | 56164089 | $-4,357,422 | -4357422 |
| 2001 | $59,632,667 | 59632667 | $65,991,638 | 65991638 | $-6,358,971 | -6358971 |
| 2002 | $65,156,750 | 65156750 | $68,244,471 | 68244471 | $-3,087,721 | -3087721 |
| 2003 | $71,040,000 | 71040000 | $71,318,479 | 71318479 | $-278,479 | -278479 |
| 2004 | $75,727,000 | 75727000 | $70,466,961 | 70466961 | $5,260,039 | 5260039 |
| 2005 | $78,786,000 | 78786000 | $73,264,780 | 73264780 | $5,521,220 | 5521220 |
| 2006 | $95,998,000 | 95998000 | $79,051,754 | 79051754 | $16,946,246 | 16946246 |
| 2007 | $90,230,500 | 90230500 | $83,931,138 | 83931138 | $6,299,362 | 6299362 |
| 2008 | $96,369,000 | 96369000 | $90,812,373 | 90812373 | $5,556,627 | 5556627 |
| 2009 | $103,590,000 | 103590000 | $91,093,211 | 91093211 | $12,496,789 | 12496789 |
| 2010 | $91,605,500 | 91605500 | $93,373,681 | 93373681 | $-1,768,181 | -1768181 |
| 2011 | $77,694,000 | 77694000 | $96,102,034 | 96102034 | $-18,408,034 | -18408034 |
| 2012 | $60,799,000 | 60799000 | $100,657,138 | 100657138 | $-39,858,138 | -39858138 |
| 2013 | $26,105,600 | 26105600 | $109,024,990 | 109024990 | $-82,919,390 | -82919390 |
| 2014 | $51,985,800 | 51985800 | $117,828,782 | 117828782 | $-65,842,982 | -65842982 |
| 2015 | $72,464,200 | 72464200 | $127,404,244 | 127404244 | $-54,940,044 | -54940044 |
| 2016 | $98,793,700 | 98793700 | $132,219,407 | 132219407 | $-33,425,707 | -33425707 |
| 2017 | $124,343,900 | 124343900 | $137,302,894 | 137302894 | $-12,958,994 | -12958994 |
| 2018 | $160,393,900 | 160393900 | $136,929,168 | 136929168 | $23,464,732 | 23464732 |
| 2019 | $158,043,000 | 158043000 | $136,944,257 | 136944257 | $21,098,743 | 21098743 |
| 2020 | $210,899,457 | 210899457 | $140,677,788 | 140677788 | $70,221,669 | 70221669 |
| 2021 | $187,448,657 | 187448657 | $132,162,631 | 132162631 | $55,286,026 | 55286026 |
| 2022 | $173,879,000 | 173879000 | $149,374,046 | 149374046 | $24,504,954 | 24504954 |
| 2023 | $190,917,233 | 190917233 | $160,460,390 | 160460390 | $30,456,843 | 30456843 |
| 2024 | $176,933,333 | 176933333 | $135,504,022 | 135504022 | $41,429,311 | 41429311 |
| 2025 | $101,933,333 | 101933333 | $96,417,302 | 96417302 | $5,516,031 | 5516031 |
| 2026 | $84,933,333 | 84933333 | $76,694,120 | 76694120 | $8,239,213 | 8239213 |
| 2027 | $67,233,333 | 67233333 | $58,935,617 | 58935617 | $8,297,716 | 8297716 |
| 2028 | $45,833,333 | 45833333 | $45,437,759 | 45437759 | $395,574 | 395574 |
|
 2007 Houston Astros