| Player | Player Sort | Pos | Salary | Salary Sort | Pct | Pct Sort | WARP | WARP Sort | WARP/$M | WARP/$M Sort | $/WARP | $/WARP Sort | Current Status |
|---|
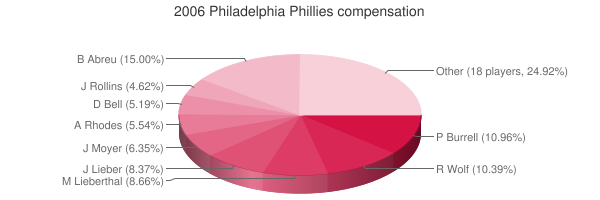
 Bobby Abreu
 |
Abreu Bobby |
RF |
$13,600,000 |
13600000 |
15.52% |
15.52 |
2.27 |
2.27427 |
0.17 |
0.16722573529412 |
$5,979,941 |
5979940.816174 |
|
 Pat Burrell
 |
Burrell Pat |
LF |
$9,750,000 |
9750000 |
11.12% |
11.12 |
4.04 |
4.03759 |
0.41 |
0.41411179487179 |
$2,414,807 |
2414806.8526027 |
|
 Randy Wolf
 |
Wolf Randy |
RP |
$9,125,000 |
9125000 |
10.41% |
10.41 |
-0.34 |
-0.344233 |
— |
0 |
— |
0 |
|
 Mike Lieberthal
 |
Lieberthal Mike |
C |
$7,500,000 |
7500000 |
8.56% |
8.56 |
1.48 |
1.48169 |
0.20 |
0.19755866666667 |
$5,061,788 |
5061787.5534019 |
|
 Jon Lieber
 |
Lieber Jon |
RP |
$7,250,000 |
7250000 |
8.27% |
8.27 |
2.17 |
2.16831 |
0.30 |
0.29907724137931 |
$3,343,618 |
3343617.8406224 |
|
 Jimmy Rollins
 |
Rollins Jimmy |
SS |
$5,000,000 |
5000000 |
5.71% |
5.71 |
5.01 |
5.00513 |
1.00 |
1.001026 |
$998,975 |
998975.05159706 |
|
 David Bell
 |
Bell David |
3B |
$4,500,000 |
4500000 |
5.13% |
5.13 |
0.96 |
0.960778 |
0.21 |
0.21350622222222 |
$4,683,704 |
4683704.2480157 |
|
 Tom Gordon
 |
Gordon Tom |
RP |
$4,500,000 |
4500000 |
5.13% |
5.13 |
1.55 |
1.54981 |
0.34 |
0.34440222222222 |
$2,903,582 |
2903581.7293733 |
|
 Arthur Rhodes
 |
Rhodes Arthur |
RP |
$3,700,000 |
3700000 |
4.22% |
4.22 |
0.38 |
0.380286 |
0.10 |
0.10278 |
$9,729,519 |
9729519.3617435 |
|
 Brett Myers
 |
Myers Brett |
RP |
$3,300,000 |
3300000 |
3.77% |
3.77 |
4.93 |
4.93053 |
1.49 |
1.4941 |
$669,299 |
669299.24369185 |
|
 Cory Lidle
 |
Lidle Cory |
RP |
$3,300,000 |
3300000 |
3.77% |
3.77 |
2.22 |
2.22181 |
0.67 |
0.67327575757576 |
$1,485,276 |
1485275.5186087 |
|
 Aaron Rowand
 |
Rowand Aaron |
CF |
$3,250,000 |
3250000 |
3.71% |
3.71 |
1.94 |
1.93664 |
0.60 |
0.59588923076923 |
$1,678,164 |
1678164.2432254 |
|
 Ryan Franklin
 |
Franklin Ryan |
RP |
$2,600,000 |
2600000 |
2.97% |
2.97 |
-0.34 |
-0.33584 |
— |
0 |
— |
0 |
|
 Rheal Cormier
 |
Cormier Rheal |
RP |
$2,500,000 |
2500000 |
2.85% |
2.85 |
-0.40 |
-0.396247 |
— |
0 |
— |
0 |
|
 Aaron Fultz
 |
Fultz Aaron |
RP |
$1,200,000 |
1200000 |
1.37% |
1.37 |
0.87 |
0.868265 |
0.72 |
0.72355416666667 |
$1,382,067 |
1382066.5349864 |
|
 Abraham O. Nunez
 |
Nunez Abraham O. |
3B |
$1,125,000 |
1125000 |
1.28% |
1.28 |
-0.28 |
-0.282222 |
— |
0 |
— |
0 |
|
 David Dellucci
 |
Dellucci David |
PH |
$950,000 |
950000 |
1.08% |
1.08 |
1.69 |
1.68961 |
1.78 |
1.7785368421053 |
$562,260 |
562259.92980629 |
|
 Alex Gonzalez
 |
Gonzalez Alex |
PH |
$750,000 |
750000 |
0.86% |
0.86 |
-0.48 |
-0.482231 |
— |
0 |
— |
0 |
|
 Chase Utley
 |
Utley Chase |
2B |
$500,000 |
500000 |
0.57% |
0.57 |
5.74 |
5.74283 |
11.49 |
11.48566 |
$87,065 |
87065.088118576 |
|
 Sal Fasano
 |
Fasano Sal |
C |
$425,000 |
425000 |
0.48% |
0.48 |
1.04 |
1.04038 |
2.45 |
2.4479529411765 |
$408,505 |
408504.58486322 |
|
 Ryan Madson
 |
Madson Ryan |
RP |
$400,000 |
400000 |
0.46% |
0.46 |
0.71 |
0.713747 |
1.78 |
1.7843675 |
$560,423 |
560422.6707783 |
|
 Kane Davis
 |
Davis Kane |
DNP |
$370,000 |
370000 |
0.42% |
0.42 |
— |
0.00 |
— |
0 |
— |
0 |
|
 Ryan Howard
 |
Howard Ryan |
1B |
$355,000 |
355000 |
0.41% |
0.41 |
5.57 |
5.57302 |
15.70 |
15.698647887324 |
$63,700 |
63699.753455039 |
|
 Jayson Werth
 |
Werth Jayson |
DNP |
$355,000 |
355000 |
0.41% |
0.41 |
— |
0.00 |
— |
0 |
— |
0 |
|
 Geoff Geary
 |
Geary Geoff |
RP |
$350,000 |
350000 |
0.40% |
0.40 |
1.27 |
1.26986 |
3.63 |
3.6281714285714 |
$275,621 |
275620.93459121 |
FA/2011 |
 Gavin Floyd
 |
Floyd Gavin |
RP |
$330,000 |
330000 |
0.38% |
0.38 |
-1.51 |
-1.50994 |
— |
0 |
— |
0 |
|
 Shane Victorino
 |
Victorino Shane |
CF |
$330,000 |
330000 |
0.38% |
0.38 |
2.37 |
2.36646 |
7.17 |
7.1710909090909 |
$139,449 |
139448.7969372 |
|
 Nate Bump
 |
Bump Nate |
DNP |
$327,000 |
327000 |
0.37% |
0.37 |
— |
0.00 |
— |
0 |
— |
0 |
|
| Year | Phillies payroll |
PR Sort |
Avg payroll |
AvgPR Sort |
Diff |
Diff Sort |
|---|
| 2000 | $47,011,333 | 47011333 | $56,164,089 | 56164089 | $-9,152,756 | -9152756 |
| 2001 | $41,911,166 | 41911166 | $65,991,638 | 65991638 | $-24,080,472 | -24080472 |
| 2002 | $58,167,499 | 58167499 | $68,244,471 | 68244471 | $-10,076,972 | -10076972 |
| 2003 | $69,676,667 | 69676667 | $71,318,479 | 71318479 | $-1,641,812 | -1641812 |
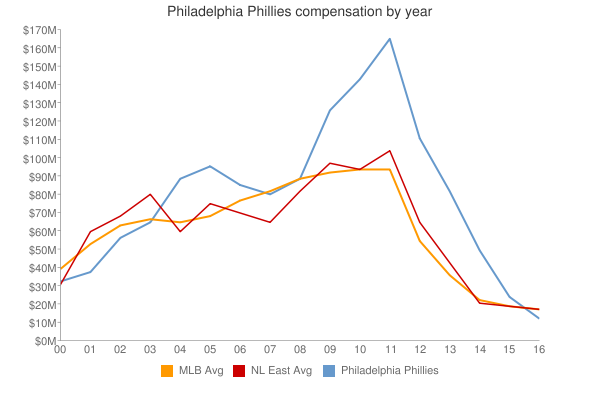
| 2004 | $92,444,167 | 92444167 | $70,466,961 | 70466961 | $21,977,206 | 21977206 |
| 2005 | $95,625,667 | 95625667 | $73,264,780 | 73264780 | $22,360,887 | 22360887 |
| 2006 | $87,642,000 | 87642000 | $79,051,754 | 79051754 | $8,590,246 | 8590246 |
| 2007 | $89,839,547 | 89839547 | $83,931,138 | 83931138 | $5,908,409 | 5908409 |
| 2008 | $96,735,047 | 96735047 | $90,812,373 | 90812373 | $5,922,674 | 5922674 |
| 2009 | $131,087,380 | 131087380 | $91,093,211 | 91093211 | $39,994,169 | 39994169 |
| 2010 | $144,178,379 | 144178379 | $93,373,681 | 93373681 | $50,804,698 | 50804698 |
| 2011 | $165,976,381 | 165976381 | $96,102,034 | 96102034 | $69,874,347 | 69874347 |
| 2012 | $172,093,283 | 172093283 | $100,657,138 | 100657138 | $71,436,145 | 71436145 |
| 2013 | $160,585,714 | 160585714 | $109,024,990 | 109024990 | $51,560,724 | 51560724 |
| 2014 | $178,729,967 | 178729967 | $117,828,782 | 117828782 | $60,901,185 | 60901185 |
| 2015 | $147,889,666 | 147889666 | $127,404,244 | 127404244 | $20,485,422 | 20485422 |
| 2016 | $95,846,667 | 95846667 | $132,219,407 | 132219407 | $-36,372,740 | -36372740 |
| 2017 | $100,041,000 | 100041000 | $137,302,894 | 137302894 | $-37,261,894 | -37261894 |
| 2018 | $95,270,301 | 95270301 | $136,929,168 | 136929168 | $-41,658,867 | -41658867 |
| 2019 | $140,611,962 | 140611962 | $136,944,257 | 136944257 | $3,667,705 | 3667705 |
| 2020 | $177,129,962 | 177129962 | $140,677,788 | 140677788 | $36,452,174 | 36452174 |
| 2021 | $191,091,962 | 191091962 | $132,162,631 | 132162631 | $58,929,331 | 58929331 |
| 2022 | $228,976,529 | 228976529 | $149,374,046 | 149374046 | $79,602,483 | 79602483 |
| 2023 | $242,776,106 | 242776106 | $160,460,390 | 160460390 | $82,315,716 | 82315716 |
| 2024 | $221,985,285 | 221985285 | $135,504,022 | 135504022 | $86,481,263 | 86481263 |
| 2025 | $221,274,285 | 221274285 | $96,417,302 | 96417302 | $124,856,983 | 124856983 |
| 2026 | $159,882,618 | 159882618 | $76,694,120 | 76694120 | $83,188,498 | 83188498 |
| 2027 | $121,382,618 | 121382618 | $58,935,617 | 58935617 | $62,447,001 | 62447001 |
| 2028 | $79,382,618 | 79382618 | $45,437,759 | 45437759 | $33,944,859 | 33944859 |
| 2029 | $75,382,618 | 75382618 | $37,269,628 | 37269628 | $38,112,990 | 38112990 |
| 2030 | $75,382,618 | 75382618 | $39,665,769 | 39665769 | $35,716,849 | 35716849 |
| 2031 | $50,811,189 | 50811189 | $38,360,152 | 38360152 | $12,451,037 | 12451037 |
| 2032 | $27,272,727 | 27272727 | $47,925,459 | 47925459 | $-20,652,732 | -20652732 |
| 2033 | $27,272,730 | 27272730 | $43,068,924 | 43068924 | $-15,796,194 | -15796194 |
|
 2006 Philadelphia Phillies