| Player | Player Sort | Pos | Salary | Salary Sort | Pct | Pct Sort | WARP | WARP Sort | WARP/$M | WARP/$M Sort | $/WARP | $/WARP Sort | Current Status |
|---|
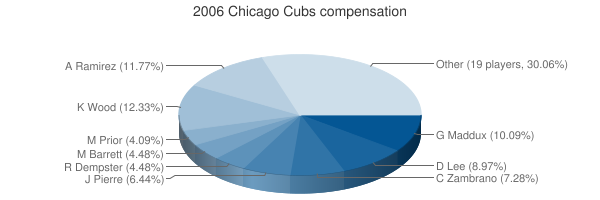
 Kerry Wood
 |
Wood Kerry |
RP |
$12,000,000 |
12000000 |
12.87% |
12.87 |
0.23 |
0.23435 |
0.02 |
0.019529166666667 |
$51,205,462 |
51205461.915938 |
|
 Aramis Ramirez
 |
Ramirez Aramis |
3B |
$10,750,000 |
10750000 |
11.53% |
11.53 |
3.31 |
3.31205 |
0.31 |
0.3080976744186 |
$3,245,724 |
3245723.9474042 |
|
 Derrek Lee
 |
Lee Derrek |
1B |
$9,416,667 |
9416667 |
10.10% |
10.10 |
0.64 |
0.642373 |
0.07 |
0.068216599355165 |
$14,659,189 |
14659188.66453 |
|
 Greg Maddux
 |
Maddux Greg |
RP |
$9,000,000 |
9000000 |
9.65% |
9.65 |
3.24 |
3.24421 |
0.36 |
0.36046777777778 |
$2,774,173 |
2774173.0652455 |
|
 Carlos Zambrano
 |
Zambrano Carlos |
RP |
$6,500,000 |
6500000 |
6.97% |
6.97 |
5.92 |
5.92181 |
0.91 |
0.91104769230769 |
$1,097,637 |
1097637.3777612 |
|
 Juan Pierre
 |
Pierre Juan |
CF |
$5,750,000 |
5750000 |
6.17% |
6.17 |
1.93 |
1.92619 |
0.33 |
0.33498956521739 |
$2,985,168 |
2985167.6106718 |
|
 Ryan Dempster
 |
Dempster Ryan |
RP |
$4,333,333 |
4333333 |
4.65% |
4.65 |
1.38 |
1.37901 |
0.32 |
0.31823310140255 |
$3,142,351 |
3142350.6718588 |
|
 Jacque Jones
 |
Jones Jacque |
RF |
$4,033,333 |
4033333 |
4.32% |
4.32 |
1.65 |
1.65423 |
0.41 |
0.41013970331733 |
$2,438,194 |
2438193.600648 |
|
 Michael Barrett
 |
Barrett Michael |
C |
$4,000,000 |
4000000 |
4.29% |
4.29 |
2.17 |
2.17431 |
0.54 |
0.5435775 |
$1,839,664 |
1839664.0773395 |
|
 Mark Prior
 |
Prior Mark |
RP |
$3,650,000 |
3650000 |
3.91% |
3.91 |
-0.12 |
-0.12176 |
— |
0 |
— |
0 |
|
 Glendon Rusch
 |
Rusch Glendon |
RP |
$2,750,000 |
2750000 |
2.95% |
2.95 |
0.87 |
0.869047 |
0.32 |
0.31601709090909 |
$3,164,386 |
3164385.8157269 |
|
 Scott Eyre
 |
Eyre Scott |
RP |
$2,700,000 |
2700000 |
2.90% |
2.90 |
1.77 |
1.76729 |
0.65 |
0.65455185185185 |
$1,527,763 |
1527762.8459393 |
|
 Todd Walker
 |
Walker Todd |
2B |
$2,500,000 |
2500000 |
2.68% |
2.68 |
0.62 |
0.617468 |
0.25 |
0.2469872 |
$4,048,793 |
4048792.8119352 |
|
 Neifi Perez
 |
Perez Neifi |
2B |
$2,500,000 |
2500000 |
2.68% |
2.68 |
0.06 |
0.0565434 |
0.02 |
0.02261736 |
$44,213,825 |
44213825.132553 |
|
 Bob Howry
 |
Howry Bob |
RP |
$2,500,000 |
2500000 |
2.68% |
2.68 |
1.64 |
1.6373 |
0.65 |
0.65492 |
$1,526,904 |
1526904.0493495 |
|
 Jerry Hairston
 |
Hairston Jerry |
2B |
$2,300,000 |
2300000 |
2.47% |
2.47 |
-0.41 |
-0.409981 |
— |
0 |
— |
0 |
|
 Scott Williamson
 |
Williamson Scott |
RP |
$2,000,000 |
2000000 |
2.14% |
2.14 |
0.66 |
0.664985 |
0.33 |
0.3324925 |
$3,007,587 |
3007586.6372926 |
|
 Henry Blanco
 |
Blanco Henry |
C |
$1,500,000 |
1500000 |
1.61% |
1.61 |
0.01 |
0.0144678 |
0.01 |
0.0096452 |
$103,678,514 |
103678513.66483 |
|
 John Mabry
 |
Mabry John |
1B |
$1,075,000 |
1075000 |
1.15% |
1.15 |
-0.09 |
-0.0868528 |
— |
0 |
— |
0 |
|
 Wade Miller
 |
Miller Wade |
RP |
$1,000,000 |
1000000 |
1.07% |
1.07 |
-0.15 |
-0.152756 |
— |
0 |
— |
0 |
|
 Will Ohman
 |
Ohman Will |
RP |
$610,000 |
610000 |
0.65% |
0.65 |
1.02 |
1.01631 |
1.67 |
1.6660819672131 |
$600,211 |
600210.56567386 |
|
 Jerome Williams
 |
Williams Jerome |
RP |
$380,000 |
380000 |
0.41% |
0.41 |
-0.02 |
-0.0249748 |
— |
0 |
— |
0 |
|
 Michael Wuertz
 |
Wuertz Michael |
RP |
$355,000 |
355000 |
0.38% |
0.38 |
0.97 |
0.969754 |
2.73 |
2.7317014084507 |
$366,072 |
366072.22037754 |
|
 Matt Murton
 |
Murton Matt |
LF |
$337,000 |
337000 |
0.36% |
0.36 |
2.95 |
2.94815 |
8.75 |
8.7482195845697 |
$114,309 |
114308.97342401 |
|
 Ronny Cedeno
 |
Cedeno Ronny |
SS |
$336,000 |
336000 |
0.36% |
0.36 |
-0.57 |
-0.565015 |
— |
0 |
— |
0 |
|
 Freddie Bynum
 |
Bynum Freddie |
PH |
$327,500 |
327500 |
0.35% |
0.35 |
0.16 |
0.156767 |
0.48 |
0.47867786259542 |
$2,089,088 |
2089087.6268602 |
|
 Ángel Pagán
 |
Pagan Angel |
LF |
$327,000 |
327000 |
0.35% |
0.35 |
0.26 |
0.258606 |
0.79 |
0.79084403669725 |
$1,264,472 |
1264471.8219995 |
|
 Sean Marshall
 |
Marshall Sean |
RP |
$327,000 |
327000 |
0.35% |
0.35 |
0.69 |
0.686861 |
2.10 |
2.1004923547401 |
$476,079 |
476078.85729427 |
|
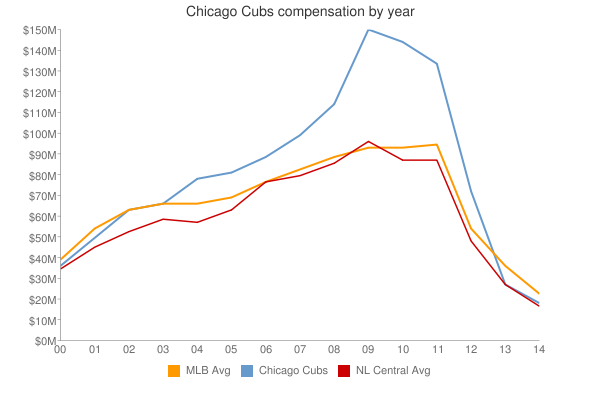
| Year | Cubs payroll |
PR Sort |
Avg payroll |
AvgPR Sort |
Diff |
Diff Sort |
|---|
| 2000 | $61,584,333 | 61584333 | $56,164,089 | 56164089 | $5,420,244 | 5420244 |
| 2001 | $64,315,833 | 64315833 | $65,991,638 | 65991638 | $-1,675,805 | -1675805 |
| 2002 | $74,959,833 | 74959833 | $68,244,471 | 68244471 | $6,715,362 | 6715362 |
| 2003 | $79,805,000 | 79805000 | $71,318,479 | 71318479 | $8,486,521 | 8486521 |
| 2004 | $89,226,667 | 89226667 | $70,466,961 | 70466961 | $18,759,706 | 18759706 |
| 2005 | $85,064,767 | 85064767 | $73,264,780 | 73264780 | $11,799,987 | 11799987 |
| 2006 | $93,257,833 | 93257833 | $79,051,754 | 79051754 | $14,206,079 | 14206079 |
| 2007 | $99,285,666 | 99285666 | $83,931,138 | 83931138 | $15,354,528 | 15354528 |
| 2008 | $120,270,833 | 120270833 | $90,812,373 | 90812373 | $29,458,460 | 29458460 |
| 2009 | $135,142,333 | 135142333 | $91,093,211 | 91093211 | $44,049,122 | 44049122 |
| 2010 | $143,359,000 | 143359000 | $93,373,681 | 93373681 | $49,985,319 | 49985319 |
| 2011 | $134,329,000 | 134329000 | $96,102,034 | 96102034 | $38,226,966 | 38226966 |
| 2012 | $111,034,202 | 111034202 | $100,657,138 | 100657138 | $10,377,064 | 10377064 |
| 2013 | $107,375,524 | 107375524 | $109,024,990 | 109024990 | $-1,649,466 | -1649466 |
| 2014 | $92,677,368 | 92677368 | $117,828,782 | 117828782 | $-25,151,414 | -25151414 |
| 2015 | $120,337,385 | 120337385 | $127,404,244 | 127404244 | $-7,066,859 | -7066859 |
| 2016 | $171,611,832 | 171611832 | $132,219,407 | 132219407 | $39,392,425 | 39392425 |
| 2017 | $172,199,881 | 172199881 | $137,302,894 | 137302894 | $34,896,987 | 34896987 |
| 2018 | $183,156,139 | 183156139 | $136,929,168 | 136929168 | $46,226,971 | 46226971 |
| 2019 | $214,246,988 | 214246988 | $136,944,257 | 136944257 | $77,302,731 | 77302731 |
| 2020 | $188,459,500 | 188459500 | $140,677,788 | 140677788 | $47,781,712 | 47781712 |
| 2021 | $152,542,000 | 152542000 | $132,162,631 | 132162631 | $20,379,369 | 20379369 |
| 2022 | $140,736,000 | 140736000 | $149,374,046 | 149374046 | $-8,638,046 | -8638046 |
| 2023 | $185,159,250 | 185159250 | $160,460,390 | 160460390 | $24,698,860 | 24698860 |
| 2024 | $192,295,000 | 192295000 | $135,504,022 | 135504022 | $56,790,978 | 56790978 |
| 2025 | $141,750,000 | 141750000 | $96,417,302 | 96417302 | $45,332,698 | 45332698 |
| 2026 | $136,250,000 | 136250000 | $76,694,120 | 76694120 | $59,555,880 | 59555880 |
| 2027 | $43,250,000 | 43250000 | $58,935,617 | 58935617 | $-15,685,617 | -15685617 |
| 2028 | $27,000,000 | 27000000 | $45,437,759 | 45437759 | $-18,437,759 | -18437759 |
| 2029 | $26,000,000 | 26000000 | $37,269,628 | 37269628 | $-11,269,628 | -11269628 |
|
 2006 Chicago Cubs