| Player | Player Sort | Pos | Salary | Salary Sort | Pct | Pct Sort | WARP | WARP Sort | WARP/$M | WARP/$M Sort | $/WARP | $/WARP Sort | Current Status |
|---|
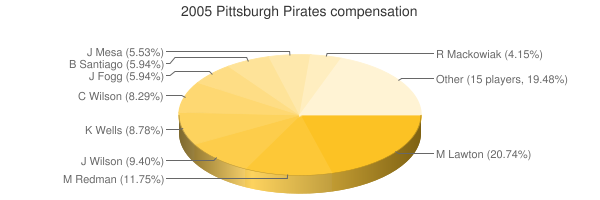
 Matt Lawton
 |
Lawton Matt |
RF |
$7,500,000 |
7500000 |
20.74% |
20.74 |
1.55 |
1.54717 |
0.21 |
0.20628933333333 |
$4,847,560 |
4847560.3844439 |
|
 Mark Redman
 |
Redman Mark |
RP |
$4,250,000 |
4250000 |
11.75% |
11.75 |
2.39 |
2.38525 |
0.56 |
0.56123529411765 |
$1,781,784 |
1781783.8800964 |
|
 Jack Wilson
 |
Wilson Jack |
SS |
$3,400,000 |
3400000 |
9.40% |
9.40 |
2.37 |
2.37027 |
0.70 |
0.69713823529412 |
$1,434,436 |
1434435.7393883 |
|
 Kip Wells
 |
Wells Kip |
RP |
$3,175,000 |
3175000 |
8.78% |
8.78 |
-0.51 |
-0.511075 |
— |
0 |
— |
0 |
|
 Craig Wilson
 |
Wilson Craig |
RF |
$3,000,000 |
3000000 |
8.29% |
8.29 |
0.94 |
0.944975 |
0.31 |
0.31499166666667 |
$3,174,687 |
3174687.161036 |
|
 Josh Fogg
 |
Fogg Josh |
RP |
$2,150,000 |
2150000 |
5.94% |
5.94 |
-1.40 |
-1.4017 |
— |
0 |
— |
0 |
|
 Benito Santiago
 |
Santiago Benito |
C |
$2,150,000 |
2150000 |
5.94% |
5.94 |
0.09 |
0.0854713 |
0.04 |
0.039754093023256 |
$25,154,643 |
25154642.552529 |
|
 Jose Mesa
 |
Mesa Jose |
RP |
$2,000,000 |
2000000 |
5.53% |
5.53 |
-0.43 |
-0.432481 |
— |
0 |
— |
0 |
|
 Rob Mackowiak
 |
Mackowiak Rob |
3B |
$1,500,000 |
1500000 |
4.15% |
4.15 |
1.69 |
1.69368 |
1.13 |
1.12912 |
$885,645 |
885645.45841009 |
|
 Brian Meadows
 |
Meadows Brian |
RP |
$1,125,000 |
1125000 |
3.11% |
3.11 |
1.23 |
1.22997 |
1.09 |
1.0933066666667 |
$914,656 |
914656.45503549 |
|
 Salomon Torres
 |
Torres Salomon |
RP |
$1,000,000 |
1000000 |
2.76% |
2.76 |
0.67 |
0.667551 |
0.67 |
0.667551 |
$1,498,013 |
1498012.8859068 |
|
 Daryle Ward
 |
Ward Daryle |
1B |
$950,000 |
950000 |
2.63% |
2.63 |
-0.61 |
-0.613123 |
— |
0 |
— |
0 |
|
 Oliver Pérez
 |
Perez Oliver |
RP |
$381,000 |
381000 |
1.05% |
1.05 |
-0.69 |
-0.689417 |
— |
0 |
— |
0 |
|
 Jason Bay
 |
Bay Jason |
LF |
$355,000 |
355000 |
0.98% |
0.98 |
7.00 |
6.99966 |
19.72 |
19.717352112676 |
$50,717 |
50716.749099242 |
|
 Dave Williams
 |
Williams Dave |
RP |
$330,000 |
330000 |
0.91% |
0.91 |
-0.31 |
-0.308275 |
— |
0 |
— |
0 |
|
 Ryan Vogelsong
 |
Vogelsong Ryan |
RP |
$330,000 |
330000 |
0.91% |
0.91 |
-0.06 |
-0.0584816 |
— |
0 |
— |
0 |
|
 Jose Castillo
 |
Castillo Jose |
2B |
$328,000 |
328000 |
0.91% |
0.91 |
0.46 |
0.455562 |
1.39 |
1.3889085365854 |
$719,990 |
719989.81477823 |
|
 John Grabow
 |
Grabow John |
RP |
$327,000 |
327000 |
0.90% |
0.90 |
0.33 |
0.326629 |
1.00 |
0.99886544342508 |
$1,001,136 |
1001135.8452556 |
|
 Humberto Cota
 |
Cota Humberto |
C |
$327,000 |
327000 |
0.90% |
0.90 |
-0.21 |
-0.212996 |
— |
0 |
— |
0 |
|
 Sean Burnett
 |
Burnett Sean |
DNP |
$321,000 |
321000 |
0.89% |
0.89 |
— |
0.00 |
— |
0 |
— |
0 |
|
 Mike Johnston
 |
Johnston Mike |
RP |
$320,000 |
320000 |
0.88% |
0.88 |
0.00 |
0.00223647 |
0.01 |
0.00698896875 |
$143,082,626 |
143082625.74504 |
|
 Tyler Yates
 |
Yates Tyler |
DNP |
$319,500 |
319500 |
0.88% |
0.88 |
— |
0.00 |
— |
0 |
— |
0 |
FA/2011 |
 Ronny Paulino
 |
Paulino Ronny |
C |
$316,000 |
316000 |
0.87% |
0.87 |
0.08 |
0.0818901 |
0.26 |
0.25914588607595 |
$3,858,830 |
3858830.3103794 |
|
 Hector Gimenez
 |
Gimenez Hector |
DNP |
$316,000 |
316000 |
0.87% |
0.87 |
— |
0.00 |
— |
0 |
— |
0 |
|
| Year | Pirates payroll |
PR Sort |
Avg payroll |
AvgPR Sort |
Diff |
Diff Sort |
|---|
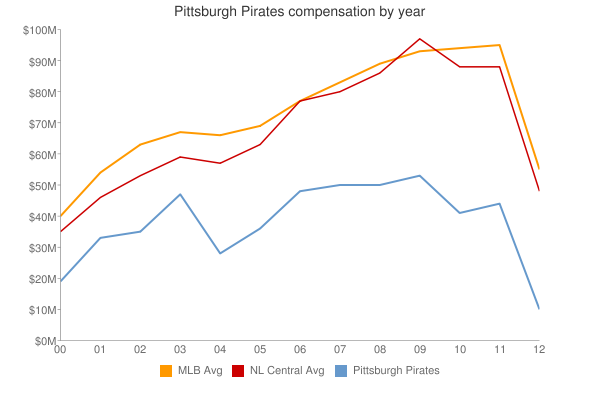
| 2000 | $27,423,334 | 27423334 | $56,164,089 | 56164089 | $-28,740,755 | -28740755 |
| 2001 | $56,110,833 | 56110833 | $65,991,638 | 65991638 | $-9,880,805 | -9880805 |
| 2002 | $41,911,099 | 41911099 | $68,244,471 | 68244471 | $-26,333,372 | -26333372 |
| 2003 | $54,761,833 | 54761833 | $71,318,479 | 71318479 | $-16,556,646 | -16556646 |
| 2004 | $30,716,500 | 30716500 | $70,466,961 | 70466961 | $-39,750,461 | -39750461 |
| 2005 | $36,170,500 | 36170500 | $73,264,780 | 73264780 | $-37,094,280 | -37094280 |
| 2006 | $47,700,750 | 47700750 | $79,051,754 | 79051754 | $-31,351,004 | -31351004 |
| 2007 | $41,444,500 | 41444500 | $83,931,138 | 83931138 | $-42,486,638 | -42486638 |
| 2008 | $49,113,225 | 49113225 | $90,812,373 | 90812373 | $-41,699,148 | -41699148 |
| 2009 | $51,864,000 | 51864000 | $91,093,211 | 91093211 | $-39,229,211 | -39229211 |
| 2010 | $38,668,000 | 38668000 | $93,373,681 | 93373681 | $-54,705,681 | -54705681 |
| 2011 | $44,485,667 | 44485667 | $96,102,034 | 96102034 | $-51,616,367 | -51616367 |
| 2012 | $51,932,000 | 51932000 | $100,657,138 | 100657138 | $-48,725,138 | -48725138 |
| 2013 | $66,805,000 | 66805000 | $109,024,990 | 109024990 | $-42,219,990 | -42219990 |
| 2014 | $71,929,333 | 71929333 | $117,828,782 | 117828782 | $-45,899,449 | -45899449 |
| 2015 | $90,303,000 | 90303000 | $127,404,244 | 127404244 | $-37,101,244 | -37101244 |
| 2016 | $99,945,500 | 99945500 | $132,219,407 | 132219407 | $-32,273,907 | -32273907 |
| 2017 | $95,807,004 | 95807004 | $137,302,894 | 137302894 | $-41,495,890 | -41495890 |
| 2018 | $86,340,001 | 86340001 | $136,929,168 | 136929168 | $-50,589,167 | -50589167 |
| 2019 | $74,808,000 | 74808000 | $136,944,257 | 136944257 | $-62,136,257 | -62136257 |
| 2020 | $53,939,500 | 53939500 | $140,677,788 | 140677788 | $-86,738,288 | -86738288 |
| 2021 | $55,452,000 | 55452000 | $132,162,631 | 132162631 | $-76,710,631 | -76710631 |
| 2022 | $55,761,800 | 55761800 | $149,374,046 | 149374046 | $-93,612,246 | -93612246 |
| 2023 | $72,777,500 | 72777500 | $160,460,390 | 160460390 | $-87,682,890 | -87682890 |
| 2024 | $53,029,000 | 53029000 | $135,504,022 | 135504022 | $-82,475,022 | -82475022 |
| 2025 | $34,661,500 | 34661500 | $96,417,302 | 96417302 | $-61,755,802 | -61755802 |
| 2026 | $38,161,500 | 38161500 | $76,694,120 | 76694120 | $-38,532,620 | -38532620 |
| 2027 | $40,661,500 | 40661500 | $58,935,617 | 58935617 | $-18,274,117 | -18274117 |
| 2028 | $43,661,500 | 43661500 | $45,437,759 | 45437759 | $-1,776,259 | -1776259 |
| 2029 | $23,250,000 | 23250000 | $37,269,628 | 37269628 | $-14,019,628 | -14019628 |
| 2030 | $21,250,000 | 21250000 | $39,665,769 | 39665769 | $-18,415,769 | -18415769 |
| 2031 | $2,000,000 | 2000000 | $38,360,152 | 38360152 | $-36,360,152 | -36360152 |
|
 2005 Pittsburgh Pirates