| Player | Player Sort | Pos | Salary | Salary Sort | Pct | Pct Sort | WARP | WARP Sort | WARP/$M | WARP/$M Sort | $/WARP | $/WARP Sort | Current Status |
|---|
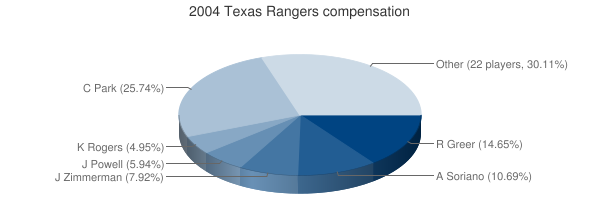
 Chan Ho Park
 |
Park Chan Ho |
RP |
$14,000,000 |
14000000 |
25.32% |
25.32 |
-0.49 |
-0.488638 |
— |
0 |
— |
0 |
|
 Rusty Greer
 |
Greer Rusty |
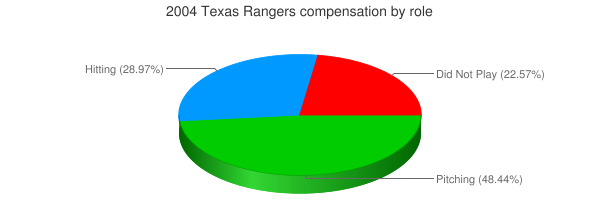
DNP |
$7,400,000 |
7400000 |
13.38% |
13.38 |
— |
0.00 |
— |
0 |
— |
0 |
|
 Alfonso Soriano
 |
Soriano Alfonso |
2B |
$5,400,000 |
5400000 |
9.76% |
9.76 |
1.65 |
1.65115 |
0.31 |
0.30576851851852 |
$3,270,448 |
3270447.8696666 |
|
 Jeff Zimmerman
 |
Zimmerman Jeff |
DNP |
$4,466,667 |
4466667 |
8.08% |
8.08 |
— |
0.00 |
— |
0 |
— |
0 |
|
 Jay Powell
 |
Powell Jay |
RP |
$3,500,000 |
3500000 |
6.33% |
6.33 |
0.26 |
0.257611 |
0.07 |
0.073603142857143 |
$13,586,376 |
13586376.358152 |
|
 Mark Teixeira
 |
Teixeira Mark |
1B |
$2,625,000 |
2625000 |
4.75% |
4.75 |
4.72 |
4.72137 |
1.80 |
1.7986171428571 |
$555,983 |
555982.69146455 |
|
 Kenny Rogers
 |
Rogers Kenny |
RP |
$2,500,000 |
2500000 |
4.52% |
4.52 |
0.34 |
0.339071 |
0.14 |
0.1356284 |
$7,373,087 |
7373087.0525642 |
|
 Francisco Cordero
 |
Cordero Francisco |
RP |
$2,000,000 |
2000000 |
3.62% |
3.62 |
2.11 |
2.10938 |
1.05 |
1.05469 |
$948,146 |
948145.9006912 |
|
 Herbert Perry
 |
Perry Herbert |
DH |
$1,700,000 |
1700000 |
3.07% |
3.07 |
-0.33 |
-0.332206 |
— |
0 |
— |
0 |
|
 Jeff Nelson
 |
Nelson Jeff |
RP |
$1,500,000 |
1500000 |
2.71% |
2.71 |
0.16 |
0.159917 |
0.11 |
0.10661133333333 |
$9,379,866 |
9379865.8053865 |
|
 Brian Jordan
 |
Jordan Brian |
RF |
$1,250,000 |
1250000 |
2.26% |
2.26 |
-0.75 |
-0.749855 |
— |
0 |
— |
0 |
|
 Michael Young
 |
Young Michael |
SS |
$1,000,000 |
1000000 |
1.81% |
1.81 |
1.91 |
1.91169 |
1.91 |
1.91169 |
$523,097 |
523097.36411238 |
|
 Brad Fullmer
 |
Fullmer Brad |
DH |
$1,000,000 |
1000000 |
1.81% |
1.81 |
0.10 |
0.10366 |
0.10 |
0.10366 |
$9,646,923 |
9646922.6316805 |
|
 Eric Young
 |
Young Eric |
LF |
$1,000,000 |
1000000 |
1.81% |
1.81 |
0.19 |
0.188412 |
0.19 |
0.188412 |
$5,307,518 |
5307517.5678831 |
|
 David Dellucci
 |
Dellucci David |
LF |
$750,000 |
750000 |
1.36% |
1.36 |
0.84 |
0.840278 |
1.12 |
1.1203706666667 |
$892,562 |
892561.74742169 |
|
 Rod Barajas
 |
Barajas Rod |
C |
$500,000 |
500000 |
0.90% |
0.90 |
1.06 |
1.05784 |
2.12 |
2.11568 |
$472,661 |
472661.27202602 |
|
 Ron Mahay
 |
Mahay Ron |
RP |
$500,000 |
500000 |
0.90% |
0.90 |
0.58 |
0.581778 |
1.16 |
1.163556 |
$859,434 |
859434.35468512 |
|
 Hank Blalock
 |
Blalock Hank |
3B |
$500,000 |
500000 |
0.90% |
0.90 |
2.95 |
2.94532 |
5.89 |
5.89064 |
$169,761 |
169760.8409273 |
|
 Carlos Almanzar
 |
Almanzar Carlos |
RP |
$420,000 |
420000 |
0.76% |
0.76 |
0.50 |
0.500333 |
1.19 |
1.191269047619 |
$839,441 |
839440.93233906 |
|
 Ryan Drese
 |
Drese Ryan |
RP |
$372,500 |
372500 |
0.67% |
0.67 |
0.53 |
0.529901 |
1.42 |
1.4225530201342 |
$702,961 |
702961.49658144 |
|
 Brian Shouse
 |
Shouse Brian |
RP |
$360,000 |
360000 |
0.65% |
0.65 |
0.66 |
0.661354 |
1.84 |
1.8370944444444 |
$544,338 |
544337.82815255 |
|
 Kevin Mench
 |
Mench Kevin |
RF |
$345,000 |
345000 |
0.62% |
0.62 |
2.50 |
2.49797 |
7.24 |
7.2404927536232 |
$138,112 |
138112.14706342 |
|
 Colby Lewis
 |
Lewis Colby |
RP |
$337,500 |
337500 |
0.61% |
0.61 |
-0.24 |
-0.244302 |
— |
0 |
— |
0 |
|
 R.A. Dickey
 |
Dickey R.A. |
RP |
$337,500 |
337500 |
0.61% |
0.61 |
-0.81 |
-0.814093 |
— |
0 |
— |
0 |
|
 Joaquin Benoit
 |
Benoit Joaquin |
RP |
$335,000 |
335000 |
0.61% |
0.61 |
0.75 |
0.747814 |
2.23 |
2.2322805970149 |
$447,972 |
447972.35676251 |
|
 Erasmo Ramirez
 |
Ramirez Erasmo |
RP |
$303,750 |
303750 |
0.55% |
0.55 |
0.48 |
0.479402 |
1.58 |
1.5782781893004 |
$633,602 |
633601.86232014 |
|
 Ramon Nivar
 |
Nivar Ramon |
CF |
$300,000 |
300000 |
0.54% |
0.54 |
-0.08 |
-0.0794825 |
— |
0 |
— |
0 |
|
 Gerald Laird
 |
Laird Gerald |
C |
$300,000 |
300000 |
0.54% |
0.54 |
-0.68 |
-0.677825 |
— |
0 |
— |
0 |
|
 Laynce Nix
 |
Nix Laynce |
CF |
$300,000 |
300000 |
0.54% |
0.54 |
-0.66 |
-0.662922 |
— |
0 |
— |
0 |
|
| Year | Rangers payroll |
PR Sort |
Avg payroll |
AvgPR Sort |
Diff |
Diff Sort |
|---|
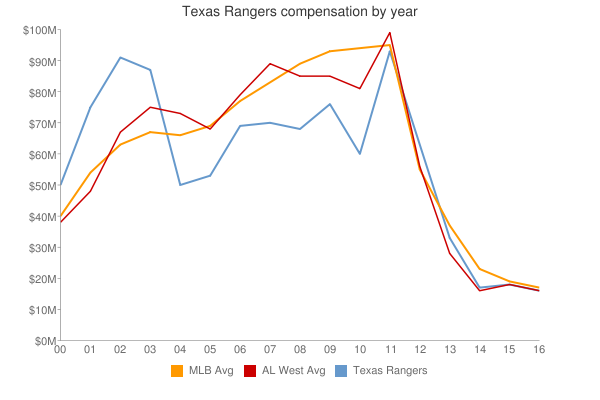
| 2000 | $69,920,921 | 69920921 | $55,368,142 | 55368142 | $14,552,779 | 14552779 |
| 2001 | $87,819,000 | 87819000 | $64,937,084 | 64937084 | $22,881,916 | 22881916 |
| 2002 | $105,876,122 | 105876122 | $67,238,672 | 67238672 | $38,637,450 | 38637450 |
| 2003 | $102,531,667 | 102531667 | $70,654,480 | 70654480 | $31,877,187 | 31877187 |
| 2004 | $55,302,917 | 55302917 | $69,466,729 | 69466729 | $-14,163,812 | -14163812 |
| 2005 | $56,670,500 | 56670500 | $74,114,841 | 74114841 | $-17,444,341 | -17444341 |
| 2006 | $68,894,360 | 68894360 | $79,621,815 | 79621815 | $-10,727,455 | -10727455 |
| 2007 | $70,934,240 | 70934240 | $85,537,470 | 85537470 | $-14,603,230 | -14603230 |
| 2008 | $68,081,980 | 68081980 | $92,003,799 | 92003799 | $-23,921,819 | -23921819 |
| 2009 | $76,255,380 | 76255380 | $92,169,598 | 92169598 | $-15,914,218 | -15914218 |
| 2010 | $58,490,000 | 58490000 | $94,342,601 | 94342601 | $-35,852,601 | -35852601 |
| 2011 | $96,713,370 | 96713370 | $96,974,710 | 96974710 | $-261,340 | -261340 |
| 2012 | $127,289,900 | 127289900 | $100,947,217 | 100947217 | $26,342,683 | 26342683 |
| 2013 | $125,340,100 | 125340100 | $108,586,966 | 108586966 | $16,753,134 | 16753134 |
| 2014 | $133,525,939 | 133525939 | $117,131,361 | 117131361 | $16,394,578 | 16394578 |
| 2015 | $143,733,540 | 143733540 | $126,168,161 | 126168161 | $17,565,379 | 17565379 |
| 2016 | $150,955,390 | 150955390 | $131,756,569 | 131756569 | $19,198,821 | 19198821 |
| 2017 | $165,348,063 | 165348063 | $136,337,445 | 136337445 | $29,010,618 | 29010618 |
| 2018 | $133,137,626 | 133137626 | $135,360,600 | 135360600 | $-2,222,974 | -2222974 |
| 2019 | $118,274,435 | 118274435 | $134,792,134 | 134792134 | $-16,517,699 | -16517699 |
| 2020 | $151,058,666 | 151058666 | $139,496,467 | 139496467 | $11,562,199 | 11562199 |
| 2021 | $96,241,250 | 96241250 | $130,712,288 | 130712288 | $-34,471,038 | -34471038 |
| 2022 | $143,943,834 | 143943834 | $149,802,695 | 149802695 | $-5,858,861 | -5858861 |
| 2023 | $196,608,190 | 196608190 | $161,692,345 | 161692345 | $34,915,845 | 34915845 |
| 2024 | $195,275,000 | 195275000 | $136,306,249 | 136306249 | $58,968,751 | 58968751 |
| 2025 | $138,750,000 | 138750000 | $98,329,527 | 98329527 | $40,420,473 | 40420473 |
| 2026 | $95,500,000 | 95500000 | $78,039,273 | 78039273 | $17,460,727 | 17460727 |
| 2027 | $94,500,000 | 94500000 | $60,919,343 | 60919343 | $33,580,657 | 33580657 |
| 2028 | $51,500,000 | 51500000 | $46,901,712 | 46901712 | $4,598,288 | 4598288 |
| 2029 | $31,500,000 | 31500000 | $38,597,944 | 38597944 | $-7,097,944 | -7097944 |
| 2030 | $31,500,000 | 31500000 | $41,447,579 | 41447579 | $-9,947,579 | -9947579 |
| 2031 | $31,500,000 | 31500000 | $38,360,152 | 38360152 | $-6,860,152 | -6860152 |
|
 2004 Texas Rangers


