| Player | Player Sort | Pos | Salary | Salary Sort | Pct | Pct Sort | WARP | WARP Sort | WARP/$M | WARP/$M Sort | $/WARP | $/WARP Sort | Current Status |
|---|
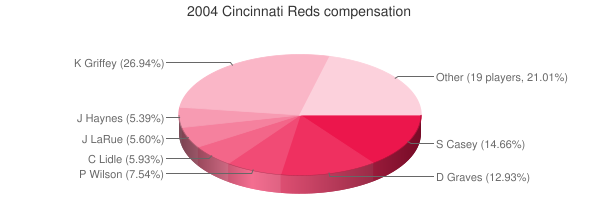
 Ken Griffey Jr.
 |
Griffey Ken |
CF |
$12,500,000 |
12500000 |
26.77% |
26.77 |
1.76 |
1.7564 |
0.14 |
0.140512 |
$7,116,830 |
7116829.8792986 |
|
 Sean Casey
 |
Casey Sean |
1B |
$6,800,000 |
6800000 |
14.56% |
14.56 |
3.41 |
3.40819 |
0.50 |
0.50120441176471 |
$1,995,194 |
1995193.9299159 |
|
 Danny Graves
 |
Graves Danny |
RP |
$6,000,000 |
6000000 |
12.85% |
12.85 |
0.46 |
0.455112 |
0.08 |
0.075852 |
$13,183,568 |
13183568.000844 |
|
 Paul Wilson
 |
Wilson Paul |
RP |
$3,500,000 |
3500000 |
7.50% |
7.50 |
0.46 |
0.464084 |
0.13 |
0.13259542857143 |
$7,541,738 |
7541738.1336137 |
|
 Cory Lidle
 |
Lidle Cory |
RP |
$2,750,000 |
2750000 |
5.89% |
5.89 |
1.53 |
1.52736 |
0.56 |
0.55540363636364 |
$1,800,492 |
1800492.3528179 |
|
 Jason LaRue
 |
LaRue Jason |
C |
$2,600,000 |
2600000 |
5.57% |
5.57 |
0.99 |
0.989152 |
0.38 |
0.38044307692308 |
$2,628,514 |
2628514.1211866 |
|
 Jimmy Haynes
 |
Haynes Jimmy |
RP |
$2,500,000 |
2500000 |
5.35% |
5.35 |
-0.03 |
-0.0250326 |
— |
0 |
— |
0 |
|
 D'Angelo Jimenez
 |
Jimenez D'Angelo |
2B |
$1,615,000 |
1615000 |
3.46% |
3.46 |
2.04 |
2.04184 |
1.26 |
1.2642972136223 |
$790,953 |
790953.25784586 |
|
 Juan Castro
 |
Castro Juan |
3B |
$1,000,000 |
1000000 |
2.14% |
2.14 |
-0.06 |
-0.0595287 |
— |
0 |
— |
0 |
|
 Barry Larkin
 |
Larkin Barry |
SS |
$700,000 |
700000 |
1.50% |
1.50 |
1.50 |
1.50499 |
2.15 |
2.1499857142857 |
$465,119 |
465119.36956392 |
|
 John Vander Wal
 |
Vander Wal John |
PH |
$700,000 |
700000 |
1.50% |
1.50 |
-0.35 |
-0.349697 |
— |
0 |
— |
0 |
|
 John Riedling
 |
Riedling John |
RP |
$650,000 |
650000 |
1.39% |
1.39 |
-0.77 |
-0.770064 |
— |
0 |
— |
0 |
|
 Javier Valentin
 |
Valentin Javier |
C |
$500,000 |
500000 |
1.07% |
1.07 |
0.04 |
0.0426729 |
0.09 |
0.0853458 |
$11,717,038 |
11717038.213948 |
|
 Todd Jones
 |
Jones Todd |
RP |
$500,000 |
500000 |
1.07% |
1.07 |
0.20 |
0.200282 |
0.40 |
0.400564 |
$2,496,480 |
2496479.9632518 |
|
 Adam Dunn
 |
Dunn Adam |
LF |
$445,000 |
445000 |
0.95% |
0.95 |
4.29 |
4.2942 |
9.65 |
9.6498876404494 |
$103,628 |
103628.14959713 |
|
 Austin Kearns
 |
Kearns Austin |
RF |
$400,000 |
400000 |
0.86% |
0.86 |
-0.24 |
-0.243867 |
— |
0 |
— |
0 |
|
 Aaron Harang
 |
Harang Aaron |
RP |
$360,000 |
360000 |
0.77% |
0.77 |
2.03 |
2.03476 |
5.65 |
5.6521111111111 |
$176,925 |
176925.04275689 |
|
 Wily Mo Pena
 |
Pena Wily Mo |
RF |
$345,000 |
345000 |
0.74% |
0.74 |
2.13 |
2.12627 |
6.16 |
6.1631014492754 |
$162,256 |
162255.9693736 |
|
 Jose Acevedo
 |
Acevedo Jose |
RP |
$340,000 |
340000 |
0.73% |
0.73 |
0.77 |
0.76681 |
2.26 |
2.2553235294118 |
$443,395 |
443395.36521433 |
|
 Brian Reith
 |
Reith Brian |
RP |
$327,250 |
327250 |
0.70% |
0.70 |
-0.39 |
-0.394052 |
— |
0 |
— |
0 |
|
 Ray Olmedo
 |
Olmedo Ray |
SS |
$322,000 |
322000 |
0.69% |
0.69 |
0.03 |
0.0305407 |
0.09 |
0.094846894409938 |
$10,543,308 |
10543307.782729 |
|
 Ryan Freel
 |
Freel Ryan |
3B |
$320,000 |
320000 |
0.69% |
0.69 |
3.47 |
3.46728 |
10.84 |
10.83525 |
$92,291 |
92291.363835629 |
|
 Corky Miller
 |
Miller Corky |
C |
$317,000 |
317000 |
0.68% |
0.68 |
-0.71 |
-0.70684 |
— |
0 |
— |
0 |
|
 Phil Norton
 |
Norton Phil |
RP |
$303,500 |
303500 |
0.65% |
0.65 |
0.64 |
0.636505 |
2.10 |
2.097215815486 |
$476,823 |
476822.64868304 |
|
 Ryan Wagner
 |
Wagner Ryan |
RP |
$302,500 |
302500 |
0.65% |
0.65 |
-0.07 |
-0.0662612 |
— |
0 |
— |
0 |
|
 D.J. Mattox
 |
Mattox D.J. |
DNP |
$300,000 |
300000 |
0.64% |
0.64 |
— |
0.00 |
— |
0 |
— |
0 |
|
 Todd Van Poppel
 |
Van Poppel Todd |
RP |
$300,000 |
300000 |
0.64% |
0.64 |
-0.79 |
-0.793945 |
— |
0 |
— |
0 |
|
| Year | Reds payroll |
PR Sort |
Avg payroll |
AvgPR Sort |
Diff |
Diff Sort |
|---|
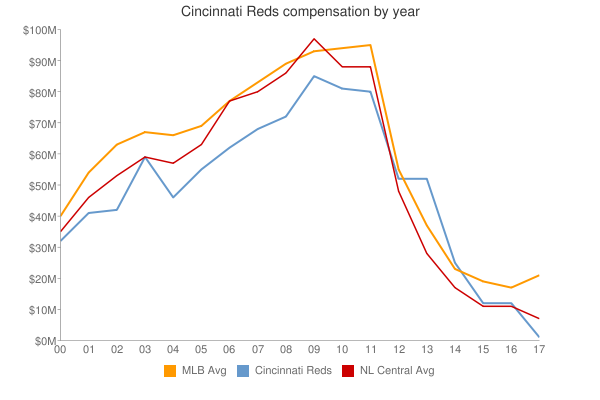
| 2000 | $44,767,200 | 44767200 | $55,368,142 | 55368142 | $-10,600,942 | -10600942 |
| 2001 | $47,974,000 | 47974000 | $64,937,084 | 64937084 | $-16,963,084 | -16963084 |
| 2002 | $43,203,890 | 43203890 | $67,238,672 | 67238672 | $-24,034,782 | -24034782 |
| 2003 | $58,541,000 | 58541000 | $70,654,480 | 70654480 | $-12,113,480 | -12113480 |
| 2004 | $46,697,250 | 46697250 | $69,466,729 | 69466729 | $-22,769,479 | -22769479 |
| 2005 | $62,594,583 | 62594583 | $74,114,841 | 74114841 | $-11,520,258 | -11520258 |
| 2006 | $63,631,833 | 63631833 | $79,621,815 | 79621815 | $-15,989,982 | -15989982 |
| 2007 | $69,910,833 | 69910833 | $85,537,470 | 85537470 | $-15,626,637 | -15626637 |
| 2008 | $72,240,000 | 72240000 | $92,003,799 | 92003799 | $-19,763,799 | -19763799 |
| 2009 | $72,283,500 | 72283500 | $92,169,598 | 92169598 | $-19,886,098 | -19886098 |
| 2010 | $76,876,500 | 76876500 | $94,342,601 | 94342601 | $-17,466,101 | -17466101 |
| 2011 | $76,631,134 | 76631134 | $96,974,710 | 96974710 | $-20,343,576 | -20343576 |
| 2012 | $87,826,167 | 87826167 | $100,947,217 | 100947217 | $-13,121,050 | -13121050 |
| 2013 | $111,105,533 | 111105533 | $108,586,966 | 108586966 | $2,518,567 | 2518567 |
| 2014 | $115,384,724 | 115384724 | $117,131,361 | 117131361 | $-1,746,637 | -1746637 |
| 2015 | $115,373,953 | 115373953 | $126,168,161 | 126168161 | $-10,794,208 | -10794208 |
| 2016 | $90,416,228 | 90416228 | $131,756,569 | 131756569 | $-41,340,341 | -41340341 |
| 2017 | $95,375,786 | 95375786 | $136,337,445 | 136337445 | $-40,961,659 | -40961659 |
| 2018 | $101,337,500 | 101337500 | $135,360,600 | 135360600 | $-34,023,100 | -34023100 |
| 2019 | $127,218,214 | 127218214 | $134,792,134 | 134792134 | $-7,573,920 | -7573920 |
| 2020 | $145,670,792 | 145670792 | $139,496,467 | 139496467 | $6,174,325 | 6174325 |
| 2021 | $129,642,381 | 129642381 | $130,712,288 | 130712288 | $-1,069,907 | -1069907 |
| 2022 | $107,955,000 | 107955000 | $149,802,695 | 149802695 | $-41,847,695 | -41847695 |
| 2023 | $94,198,333 | 94198333 | $161,692,345 | 161692345 | $-67,494,012 | -67494012 |
| 2024 | $100,758,333 | 100758333 | $136,306,249 | 136306249 | $-35,547,916 | -35547916 |
| 2025 | $74,483,333 | 74483333 | $98,329,527 | 98329527 | $-23,846,194 | -23846194 |
| 2026 | $45,483,333 | 45483333 | $78,039,273 | 78039273 | $-32,555,940 | -32555940 |
| 2027 | $42,483,333 | 42483333 | $60,919,343 | 60919343 | $-18,436,010 | -18436010 |
| 2028 | $16,333,333 | 16333333 | $46,901,712 | 46901712 | $-30,568,379 | -30568379 |
| 2029 | $2,000,000 | 2000000 | $38,597,944 | 38597944 | $-36,597,944 | -36597944 |
|
 2004 Cincinnati Reds


